## Grid of Scatter Plots: Fraction of Variance in Centered and Averaged Activations Explained by PCs
### Overview
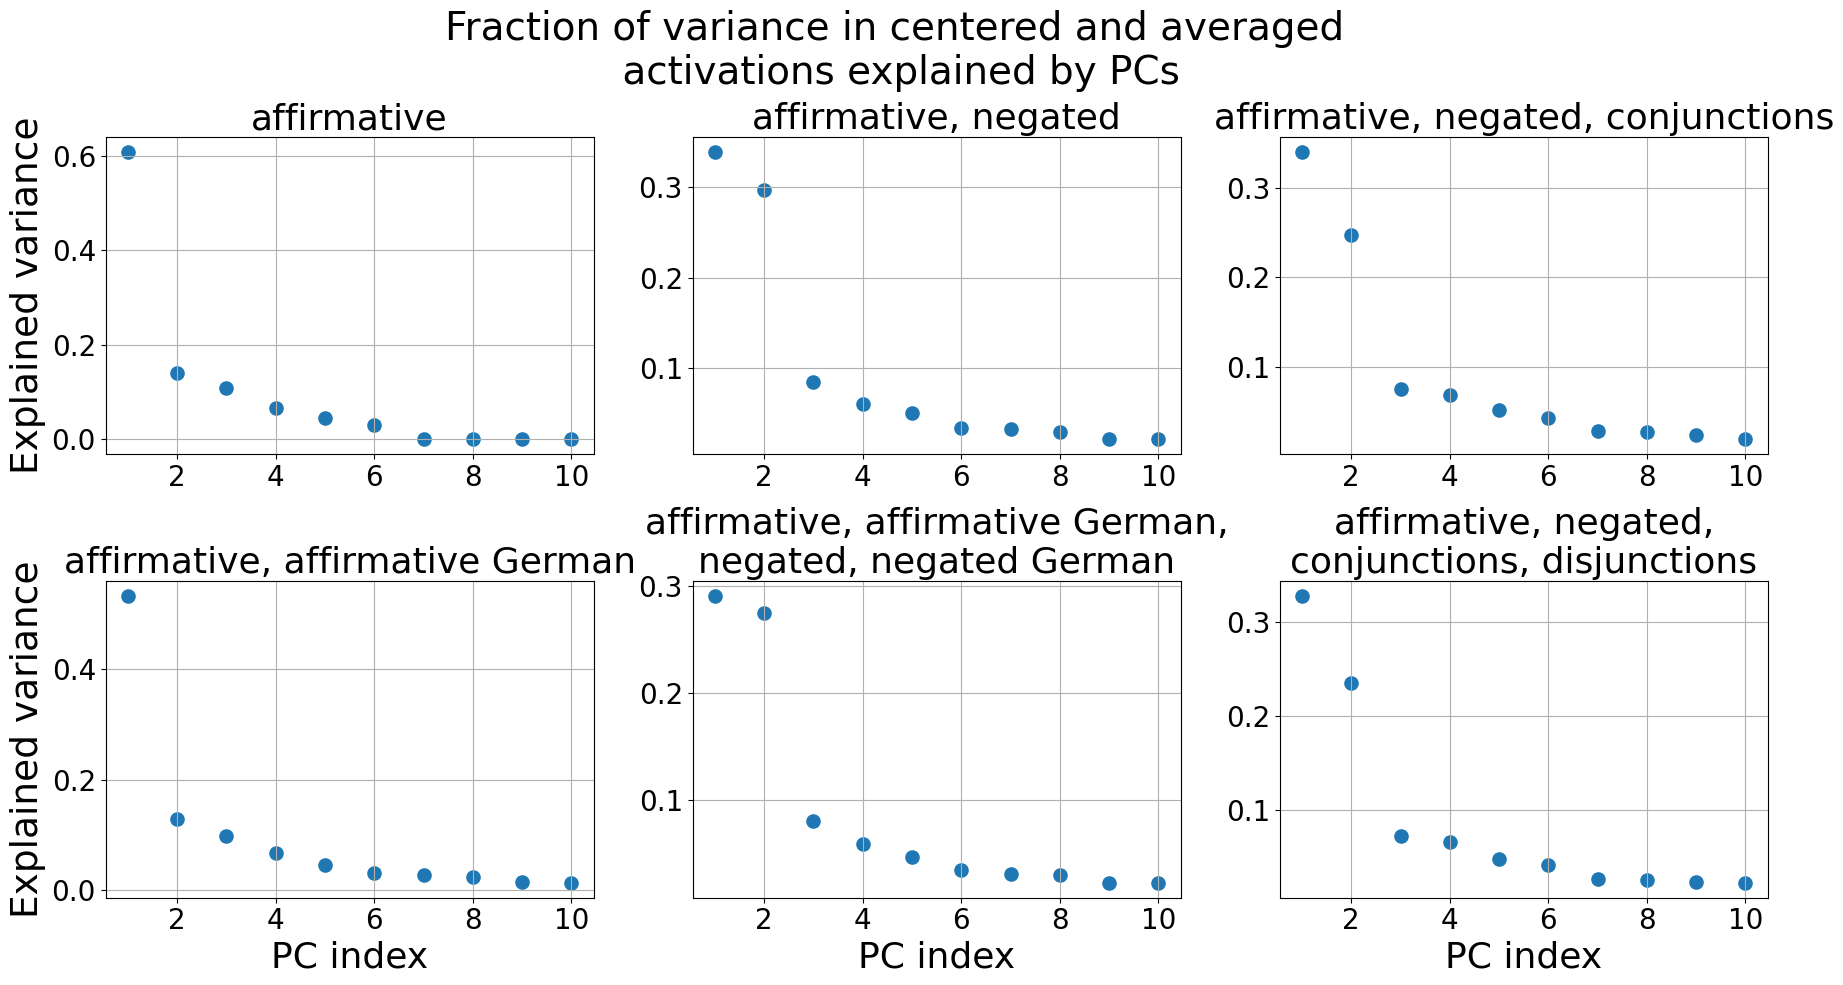
The image contains six scatter plots arranged in two rows of three, each visualizing the relationship between principal component (PC) index and explained variance under different linguistic conditions. All plots share consistent axes but vary in their experimental conditions (e.g., "affirmative," "affirmative, negated," etc.). Data points are represented by blue dots, with no visible legend or colorbar.
---
### Components/Axes
- **X-axis**: "PC index" (ranges from 2 to 10 in all plots)
- **Y-axis**: "Explained variance" (scales vary: 0–0.6 in top-left, 0–0.3 in others)
- **Chart Titles**: Positioned at the top of each plot, specifying conditions (e.g., "affirmative," "affirmative, negated, conjunctions").
- **Data Points**: Blue dots with no explicit markers or error bars.
---
### Detailed Analysis
#### Top Row
1. **affirmative**
- Highest explained variance at PC 2 (~0.6).
- Sharp decline to near-zero by PC 6.
- Minimal variance for PCs 8–10.
2. **affirmative, negated**
- Explained variance starts at ~0.3 (PC 2).
- Gradual decline to ~0.05 by PC 6.
- Flattens near zero for PCs 8–10.
3. **affirmative, negated, conjunctions**
- Starts at ~0.3 (PC 2).
- Steeper decline to ~0.05 by PC 4.
- Remains near zero for PCs 6–10.
#### Bottom Row
4. **affirmative, affirmative German**
- Explained variance at PC 2 (~0.45).
- Gradual decline to ~0.05 by PC 6.
- Flattens near zero for PCs 8–10.
5. **affirmative, affirmative German, negated German**
- Starts at ~0.3 (PC 2).
- Slightly steeper decline than Plot 4.
- Flattens near zero by PC 6.
6. **affirmative, negated, conjunctions, disjunctions**
- Lowest starting variance (~0.3 at PC 2).
- Gradual decline to ~0.05 by PC 4.
- Flattens near zero for PCs 6–10.
---
### Key Observations
1. **Decline with PC Index**: All plots show a consistent drop in explained variance as PC index increases, suggesting diminishing returns in variance explanation with higher PCs.
2. **Condition Complexity**:
- Simplest condition ("affirmative") explains the most variance (~0.6).
- Adding negations, conjunctions, or disjunctions reduces explained variance.
- German language variants show slightly lower variance than English equivalents.
3. **Conjunctions/Disjunctions Impact**: The final plot (most complex conditions) has the lowest variance, indicating these syntactic structures contribute minimally to activation patterns.
---
### Interpretation
The data suggests that neural activations are most strongly driven by simple affirmative statements, with complexity (negation, conjunctions, disjunctions) reducing the proportion of variance explained by principal components. This implies that higher-order syntactic structures have a smaller impact on the neural representations captured by PCA. The German language variants follow a similar trend but with slightly lower variance, potentially reflecting language-specific processing differences. The consistent decline across all plots highlights the dominance of low-dimensional PCs in explaining activation patterns, with higher PCs contributing minimally.