## Line Chart: log(Perplexity) vs Compacted Size
### Overview
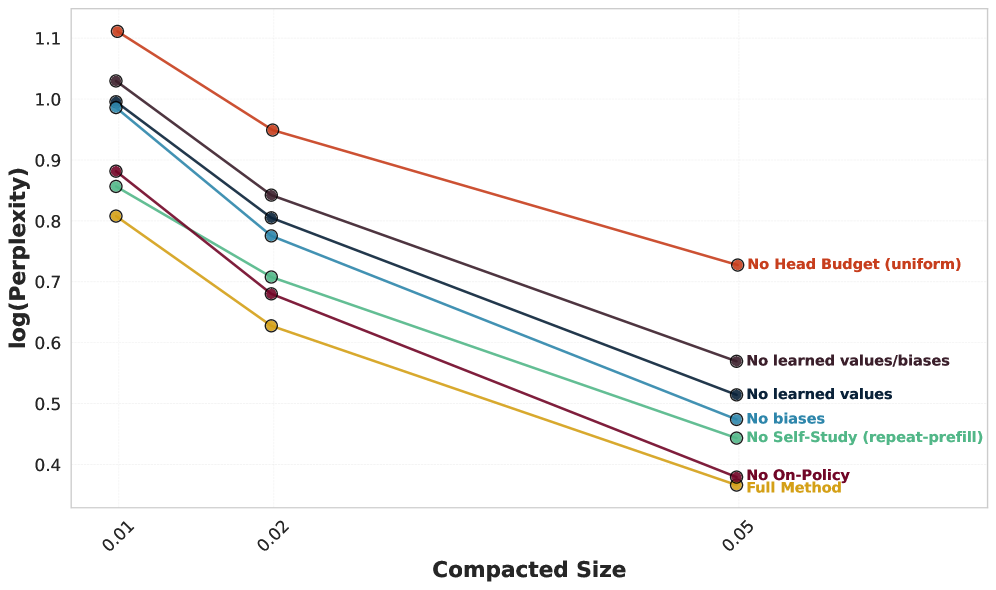
The chart visualizes the relationship between **log(Perplexity)** (y-axis) and **Compacted Size** (x-axis) for seven different methods. Each line represents a method's performance across three compacted size values: 0.01, 0.02, and 0.05. Perplexity decreases as compacted size increases for all methods, but the rate and magnitude of reduction vary.
---
### Components/Axes
- **X-axis (Compacted Size)**: Logarithmic scale with ticks at 0.01, 0.02, and 0.05.
- **Y-axis (log(Perplexity))**: Logarithmic scale ranging from 0.4 to 1.1.
- **Legend**: Positioned on the right, with seven color-coded lines:
1. **Orange**: No Head Budget (uniform)
2. **Dark Red**: No learned values/biases
3. **Dark Blue**: No learned values
4. **Light Blue**: No biases
5. **Green**: No Self-Study (repeat-prefill)
6. **Maroon**: No On-Policy
7. **Yellow**: Full Method
---
### Detailed Analysis
1. **No Head Budget (uniform)** (Orange):
- Starts at **1.1** (x=0.01) and decreases to **0.72** (x=0.05).
- Steepest decline among all methods.
2. **No learned values/biases** (Dark Red):
- Begins at **1.03** (x=0.01) and drops to **0.57** (x=0.05).
- Consistent downward trend.
3. **No learned values** (Dark Blue):
- Starts at **0.99** (x=0.01) and falls to **0.52** (x=0.05).
- Slightly less steep than "No learned values/biases."
4. **No biases** (Light Blue):
- Begins at **0.99** (x=0.01) and decreases to **0.48** (x=0.05).
- Moderate decline.
5. **No Self-Study (repeat-prefill)** (Green):
- Starts at **0.86** (x=0.01) and drops to **0.45** (x=0.05).
- Steady reduction.
6. **No On-Policy** (Maroon):
- Begins at **0.88** (x=0.01) and falls to **0.39** (x=0.05).
- Sharp decline, second only to "Full Method."
7. **Full Method** (Yellow):
- Starts at **0.81** (x=0.01) and decreases to **0.38** (x=0.05).
- Most effective at reducing perplexity.
---
### Key Observations
- **Highest Perplexity**: "No Head Budget (uniform)" consistently has the highest perplexity across all compacted sizes.
- **Lowest Perplexity**: "Full Method" achieves the lowest perplexity at all sizes.
- **Trend**: All methods show decreasing perplexity as compacted size increases, but the "Full Method" outperforms others significantly.
- **Outlier**: "No Head Budget (uniform)" maintains the highest perplexity even at the largest compacted size (0.05).
---
### Interpretation
The data suggests that the **Full Method** is the most effective at minimizing perplexity, likely due to its comprehensive approach (retaining learned values, biases, and on-policy data). In contrast, the **No Head Budget (uniform)** method performs worst, indicating that uniform head budgets without learned components are suboptimal. The logarithmic scale emphasizes relative differences, showing that even small reductions in perplexity (e.g., from 0.81 to 0.38 for the Full Method) represent substantial improvements. The trends highlight the importance of retaining learned values and biases in reducing model uncertainty.