## Line Chart: Impact of Solution Length on MR-Scores by Models
### Overview
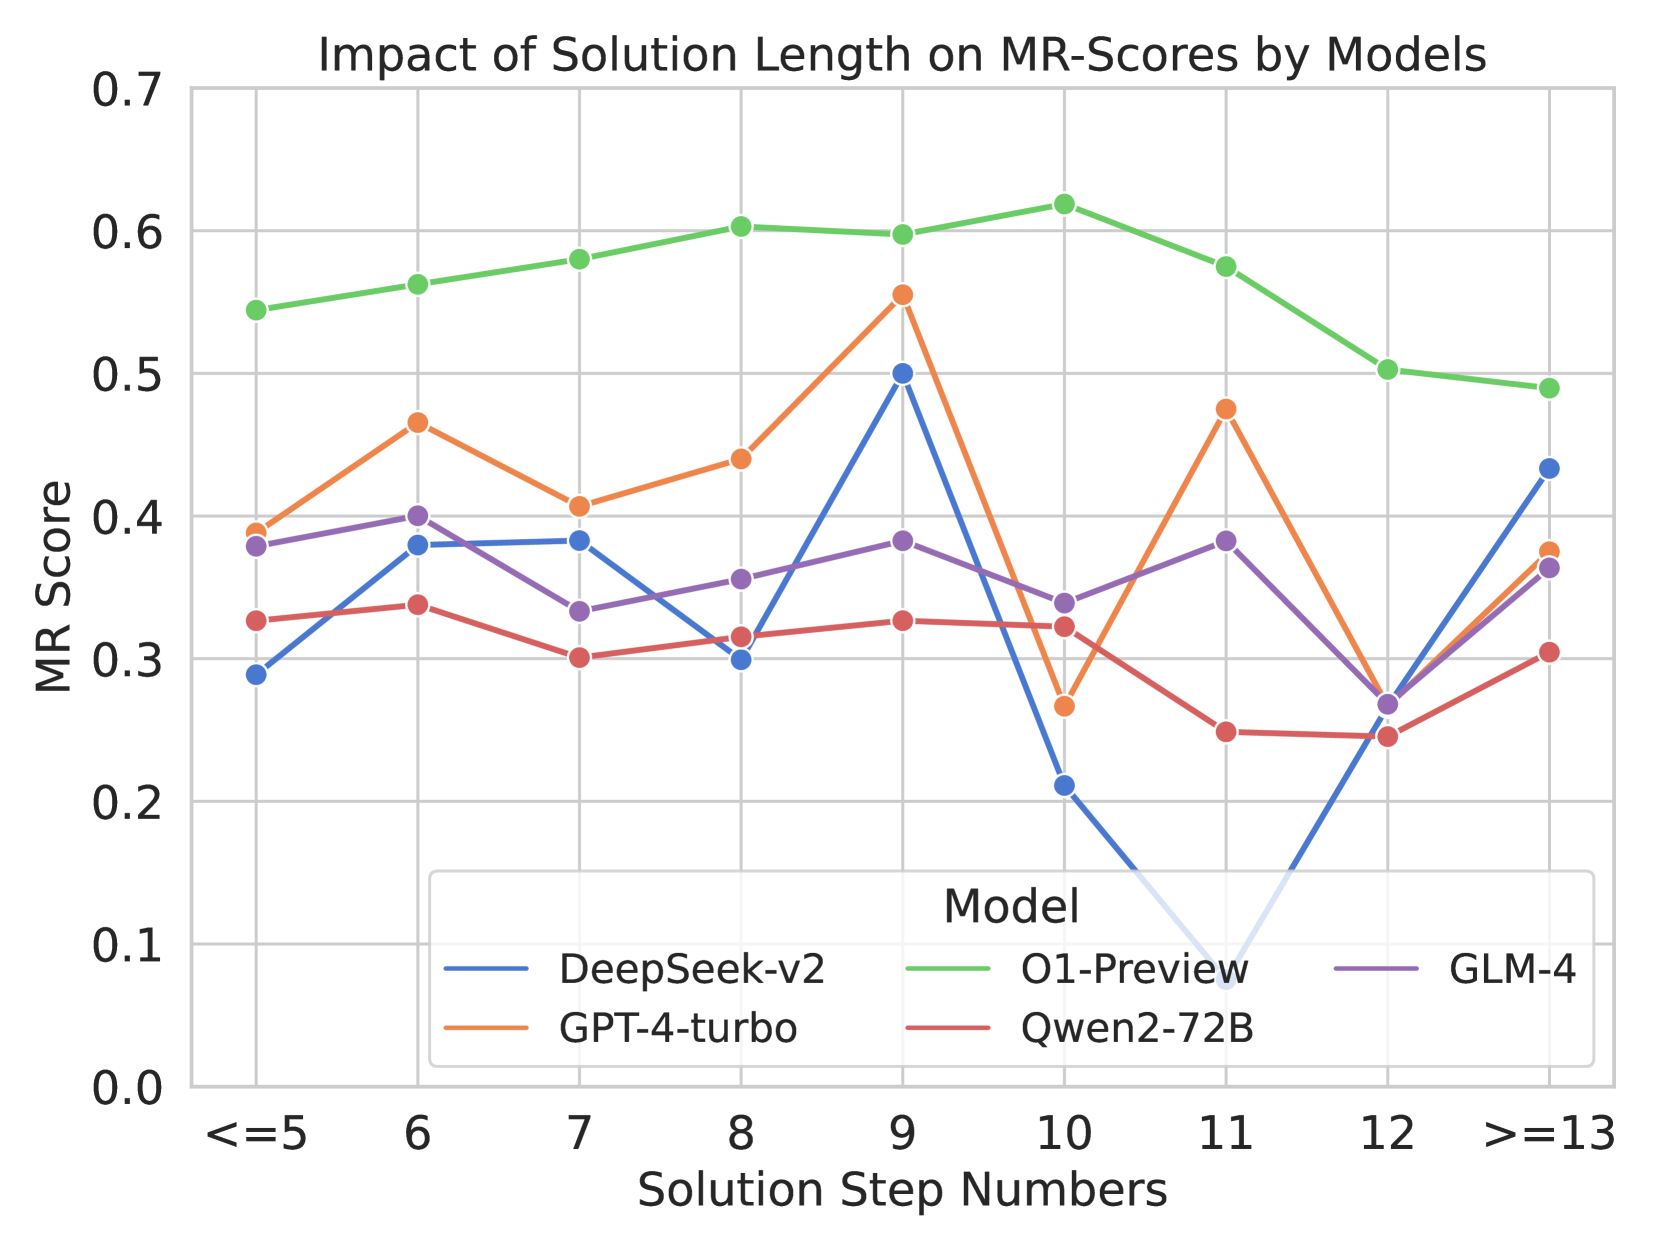
The image is a line chart comparing the MR-Scores of different models (DeepSeek-v2, GPT-4-turbo, O1-Preview, Qwen2-72B, and GLM-4) across varying solution step numbers. The x-axis represents the solution step numbers, and the y-axis represents the MR Score.
### Components/Axes
* **Title:** Impact of Solution Length on MR-Scores by Models
* **X-axis:** Solution Step Numbers, with markers at "<=5", "6", "7", "8", "9", "10", "11", "12", ">=13"
* **Y-axis:** MR Score, with markers from 0.0 to 0.7 in increments of 0.1.
* **Legend:** Located in the bottom-right corner, it identifies each model by color:
* Blue: DeepSeek-v2
* Orange: GPT-4-turbo
* Green: O1-Preview
* Red: Qwen2-72B
* Purple: GLM-4
### Detailed Analysis
* **DeepSeek-v2 (Blue):**
* Trend: Initially increases, then decreases sharply, and finally increases again.
* Data Points:
* <=5: ~0.29
* 6: ~0.34
* 7: ~0.38
* 8: ~0.30
* 9: ~0.50
* 10: ~0.21
* 11: ~0.10
* 12: ~0.25
* >=13: ~0.43
* **GPT-4-turbo (Orange):**
* Trend: Increases, then decreases, and increases again.
* Data Points:
* <=5: ~0.39
* 6: ~0.47
* 7: ~0.41
* 8: ~0.44
* 9: ~0.56
* 10: ~0.27
* 11: ~0.48
* 12: ~0.25
* >=13: ~0.38
* **O1-Preview (Green):**
* Trend: Relatively stable, with a slight increase and then a decrease.
* Data Points:
* <=5: ~0.55
* 6: ~0.56
* 7: ~0.58
* 8: ~0.60
* 9: ~0.60
* 10: ~0.62
* 11: ~0.58
* 12: ~0.50
* >=13: ~0.49
* **Qwen2-72B (Red):**
* Trend: Relatively stable, with a slight decrease and then a slight increase.
* Data Points:
* <=5: ~0.33
* 6: ~0.38
* 7: ~0.30
* 8: ~0.31
* 9: ~0.38
* 10: ~0.32
* 11: ~0.25
* 12: ~0.25
* >=13: ~0.31
* **GLM-4 (Purple):**
* Trend: Fluctuates, with an initial increase, then a decrease, and then another increase.
* Data Points:
* <=5: ~0.38
* 6: ~0.40
* 7: ~0.34
* 8: ~0.36
* 9: ~0.38
* 10: ~0.34
* 11: ~0.39
* 12: ~0.25
* >=13: ~0.36
### Key Observations
* O1-Preview consistently has the highest MR Score across all solution step numbers.
* DeepSeek-v2 shows the most significant fluctuation in MR Score, with a sharp drop at solution step number 11.
* GPT-4-turbo also shows significant fluctuation, with a peak at step number 9.
* Qwen2-72B has the most stable MR Score across all solution step numbers.
* GLM-4's performance fluctuates, but not as dramatically as DeepSeek-v2 or GPT-4-turbo.
### Interpretation
The chart illustrates how the length of the solution (measured by the number of steps) impacts the performance (MR-Score) of different models. O1-Preview appears to be the most robust model, maintaining a relatively high MR-Score regardless of the solution length. DeepSeek-v2 and GPT-4-turbo are more sensitive to solution length, with their performance varying significantly. The data suggests that the optimal solution length may differ for each model, and some models are more consistent in their performance than others. The sharp drop in DeepSeek-v2's performance at step number 11 could indicate a specific weakness or limitation of that model when dealing with solutions of that length.