TECHNICAL ASSET FINGERPRINT
56210346217dad5afc478121
Click to view fullscreen
Press ESC or click to close
FOUND IN PAPERS
EXPERT: gemini-3.1-pro-preview VERSION 1
RUNTIME: gemini/gemini-3.1-pro-preview
INTEL_VERIFIED
## Line Chart: Impact of Solution Length on MR-Scores by Models
### Overview
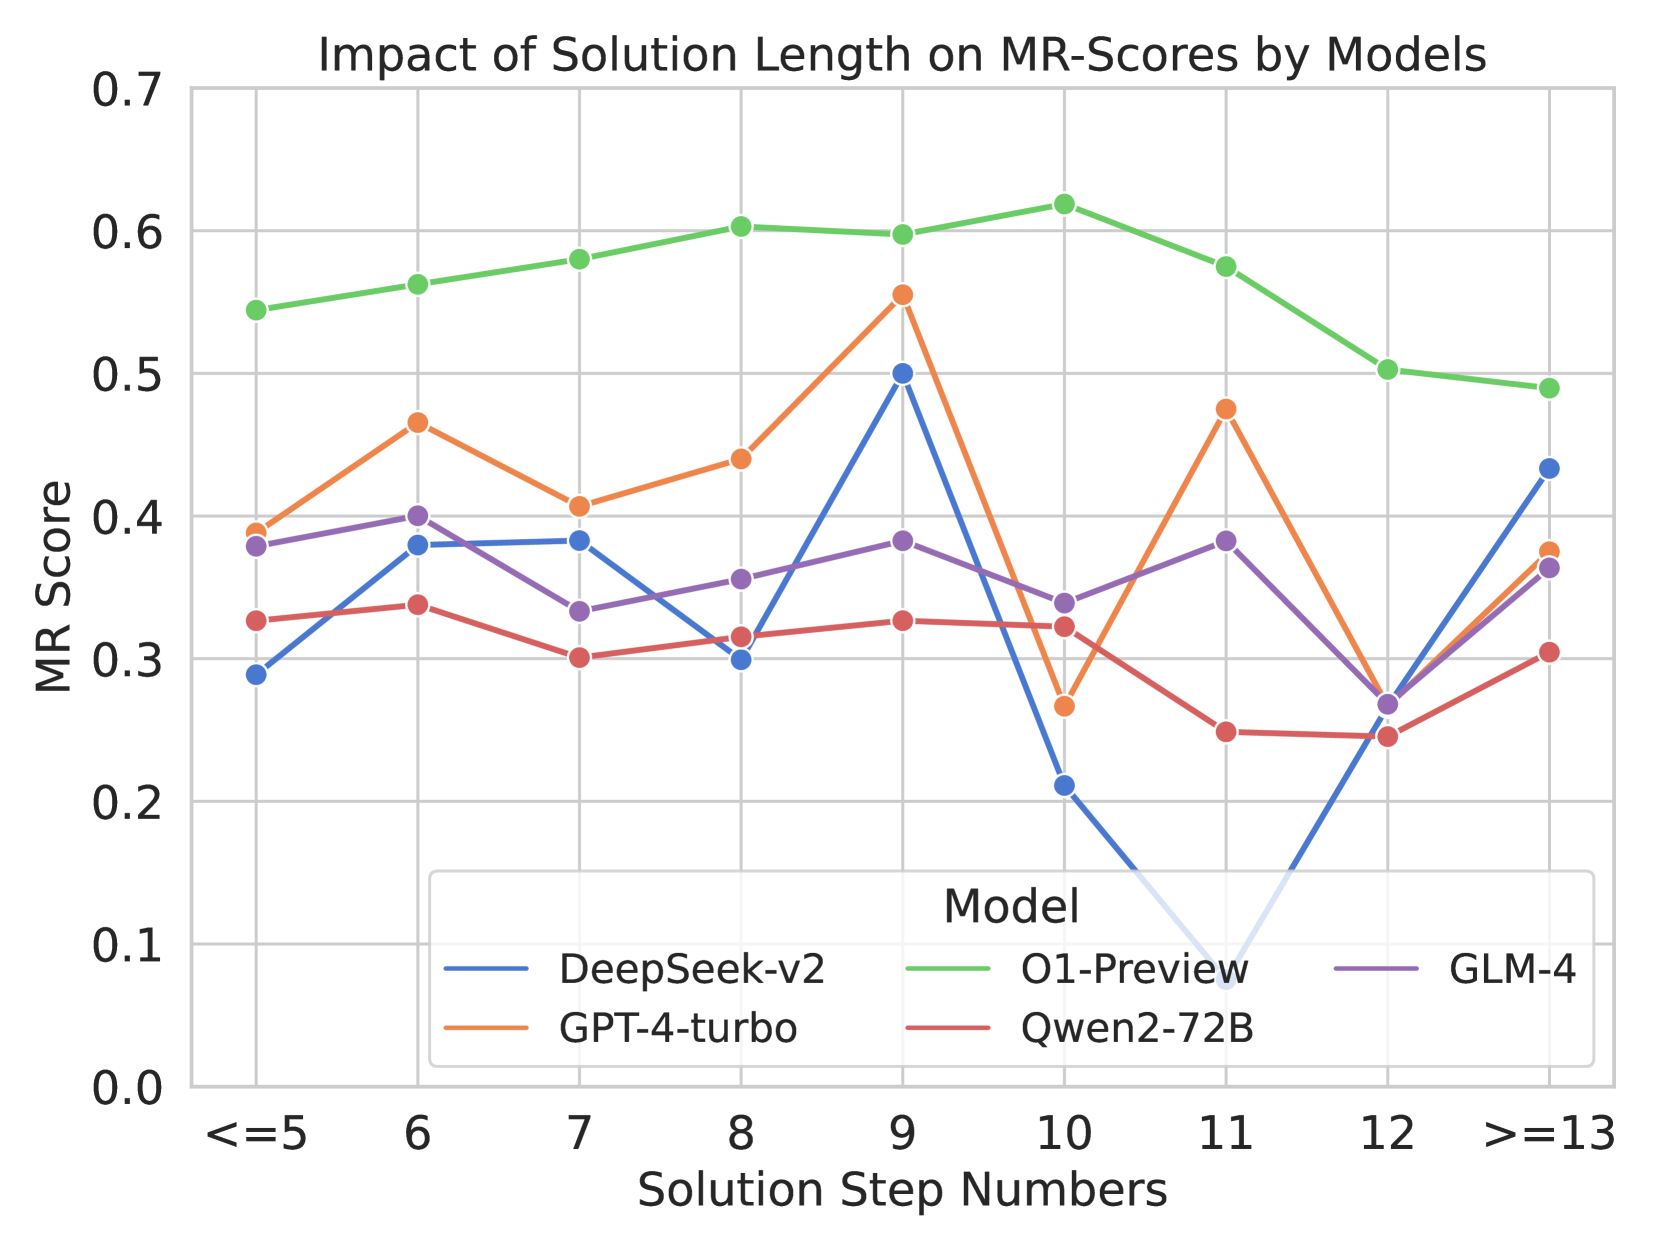
This image is a multi-series line chart illustrating the performance of five different Large Language Models (LLMs) based on the length of the solution required. Performance is measured by an "MR Score" on the y-axis, plotted against the "Solution Step Numbers" on the x-axis. The chart demonstrates how model accuracy or reliability fluctuates as the complexity (measured in steps) of the problem increases.
### Components/Axes
**Header Region:**
* **Title:** Located at the top center, reading "Impact of Solution Length on MR-Scores by Models".
**Main Chart Area:**
* **Y-Axis (Left):** Labeled "MR Score" (rotated 90 degrees counter-clockwise). The scale ranges from `0.0` to `0.7` with major tick marks and corresponding horizontal grid lines at intervals of `0.1` (0.0, 0.1, 0.2, 0.3, 0.4, 0.5, 0.6, 0.7).
* **X-Axis (Bottom):** Labeled "Solution Step Numbers" (centered below the axis). It contains categorical/ordinal bins representing step counts. Vertical grid lines align with each category. The categories are:
* `<=5`
* `6`
* `7`
* `8`
* `9`
* `10`
* `11`
* `12`
* `>=13`
**Footer/Legend Region:**
* **Legend:** Positioned inside the main chart area, in the lower-middle section (spanning horizontally from step 6 to 13, and vertically between MR scores 0.05 and 0.25). It is enclosed in a box with a light gray border.
* **Legend Title:** "Model"
* **Legend Entries (Color to Label Mapping):**
* Blue Line: `DeepSeek-v2`
* Orange Line: `GPT-4-turbo`
* Green Line: `O1-Preview`
* Red Line: `Qwen2-72B`
* Purple Line: `GLM-4`
### Detailed Analysis
*Note: All numerical values extracted from the chart are approximate visual estimates based on the placement of data points relative to the y-axis gridlines. An uncertainty margin of roughly ±0.02 applies.*
**Trend Verification and Data Extraction by Series:**
1. **O1-Preview (Green Line):**
* *Trend:* This line is consistently the highest on the chart. It shows a smooth, steady upward slope from `<=5` steps, peaking at `10` steps, followed by a steady downward slope as steps increase to `>=13`.
* *Data Points:* <=5 (~0.54), 6 (~0.56), 7 (~0.58), 8 (~0.60), 9 (~0.60), 10 (~0.62), 11 (~0.58), 12 (~0.50), >=13 (~0.49).
2. **GPT-4-turbo (Orange Line):**
* *Trend:* This line exhibits high volatility. It rises initially, dips at step 7, rises to a peak at step 9, suffers a sharp drop at step 10, spikes back up at step 11, drops sharply again at step 12, and recovers slightly at >=13.
* *Data Points:* <=5 (~0.39), 6 (~0.47), 7 (~0.41), 8 (~0.44), 9 (~0.56), 10 (~0.27), 11 (~0.48), 12 (~0.27), >=13 (~0.38).
3. **GLM-4 (Purple Line):**
* *Trend:* This line remains relatively stable in the middle of the pack. It fluctuates mildly between 0.33 and 0.40 until step 11, experiences a sharp drop at step 12, and recovers at >=13.
* *Data Points:* <=5 (~0.38), 6 (~0.40), 7 (~0.33), 8 (~0.36), 9 (~0.38), 10 (~0.34), 11 (~0.38), 12 (~0.27), >=13 (~0.36).
4. **DeepSeek-v2 (Blue Line):**
* *Trend:* Highly erratic behavior in the middle-to-late stages. It starts low, rises to a plateau at steps 6-7, dips at 8, spikes sharply to its peak at step 9, then crashes dramatically to the lowest point on the entire chart at step 11, before recovering sharply at steps 12 and >=13.
* *Data Points:* <=5 (~0.29), 6 (~0.38), 7 (~0.38), 8 (~0.30), 9 (~0.50), 10 (~0.21), 11 (~0.08), 12 (~0.26), >=13 (~0.43).
5. **Qwen2-72B (Red Line):**
* *Trend:* This line is the most stable but generally the lowest performing overall (excluding DeepSeek's crash). It remains relatively flat, hovering around the 0.30 mark, with a slight decline at steps 11 and 12 before a minor recovery.
* *Data Points:* <=5 (~0.33), 6 (~0.34), 7 (~0.30), 8 (~0.31), 9 (~0.33), 10 (~0.32), 11 (~0.25), 12 (~0.25), >=13 (~0.31).
**Reconstructed Data Table (Approximate Values):**
| Solution Step Numbers | DeepSeek-v2 (Blue) | GPT-4-turbo (Orange) | O1-Preview (Green) | Qwen2-72B (Red) | GLM-4 (Purple) |
| :--- | :--- | :--- | :--- | :--- | :--- |
| **<=5** | ~0.29 | ~0.39 | ~0.54 | ~0.33 | ~0.38 |
| **6** | ~0.38 | ~0.47 | ~0.56 | ~0.34 | ~0.40 |
| **7** | ~0.38 | ~0.41 | ~0.58 | ~0.30 | ~0.33 |
| **8** | ~0.30 | ~0.44 | ~0.60 | ~0.31 | ~0.36 |
| **9** | ~0.50 | ~0.56 | ~0.60 | ~0.33 | ~0.38 |
| **10** | ~0.21 | ~0.27 | ~0.62 | ~0.32 | ~0.34 |
| **11** | ~0.08 | ~0.48 | ~0.58 | ~0.25 | ~0.38 |
| **12** | ~0.26 | ~0.27 | ~0.50 | ~0.25 | ~0.27 |
| **>=13** | ~0.43 | ~0.38 | ~0.49 | ~0.31 | ~0.36 |
### Key Observations
* **Absolute Maximum:** O1-Preview achieves the highest overall MR Score of approximately 0.62 at 10 steps.
* **Absolute Minimum:** DeepSeek-v2 drops to the lowest overall MR Score of approximately 0.08 at 11 steps.
* **Convergence Point:** At `>=13` steps, four of the five models (DeepSeek-v2, GPT-4-turbo, GLM-4, and Qwen2-72B) converge tightly between scores of ~0.31 and ~0.43.
* **The "Step 10-12" Anomaly:** Steps 10, 11, and 12 represent a zone of extreme volatility for several models. DeepSeek-v2 crashes at 10 and 11; GPT-4-turbo crashes at 10, recovers at 11, and crashes again at 12; GLM-4 crashes at 12. Conversely, O1-Preview peaks at step 10.
### Interpretation
The data suggests a strong correlation between the number of reasoning steps required to solve a problem and the performance (MR Score) of various LLMs.
1. **Architectural Superiority in Long-Context Reasoning:** The `O1-Preview` model demonstrates a distinct advantage in handling multi-step problems. Its smooth curve suggests a robust underlying architecture that scales well with complexity up to 10 steps before experiencing a graceful degradation. It does not suffer the catastrophic failures seen in other models.
2. **Context Window/Attention Breakdown:** The extreme volatility of `DeepSeek-v2` and `GPT-4-turbo` between steps 9 and 12 strongly implies a breaking point in their attention mechanisms or context handling. The sharp spikes and crashes suggest that at these specific lengths, the models either perfectly grasp the logic or lose the thread entirely (hallucination or context dropping). DeepSeek-v2's near-zero score at step 11 is a notable catastrophic failure.
3. **Complexity Ceiling:** Across almost all models, performance begins to degrade or converge at the highest complexity level (`>=13` steps). Even the dominant O1-Preview drops from its peak of ~0.62 down to ~0.49. This indicates a general limitation in current LLM capabilities when forced to maintain logical coherence over very long chains of reasoning.
4. **Consistency vs. Peak Performance:** `Qwen2-72B` is the lowest performer on average, but it is highly consistent. It does not suffer the massive drops seen in GPT-4-turbo or DeepSeek-v2, suggesting it might be a safer, albeit less capable, choice for problems of unpredictable length where catastrophic failure is unacceptable.
DECODING INTELLIGENCE...