## Line Chart: Impact of Solution Length on MR-Scores by Models
### Overview
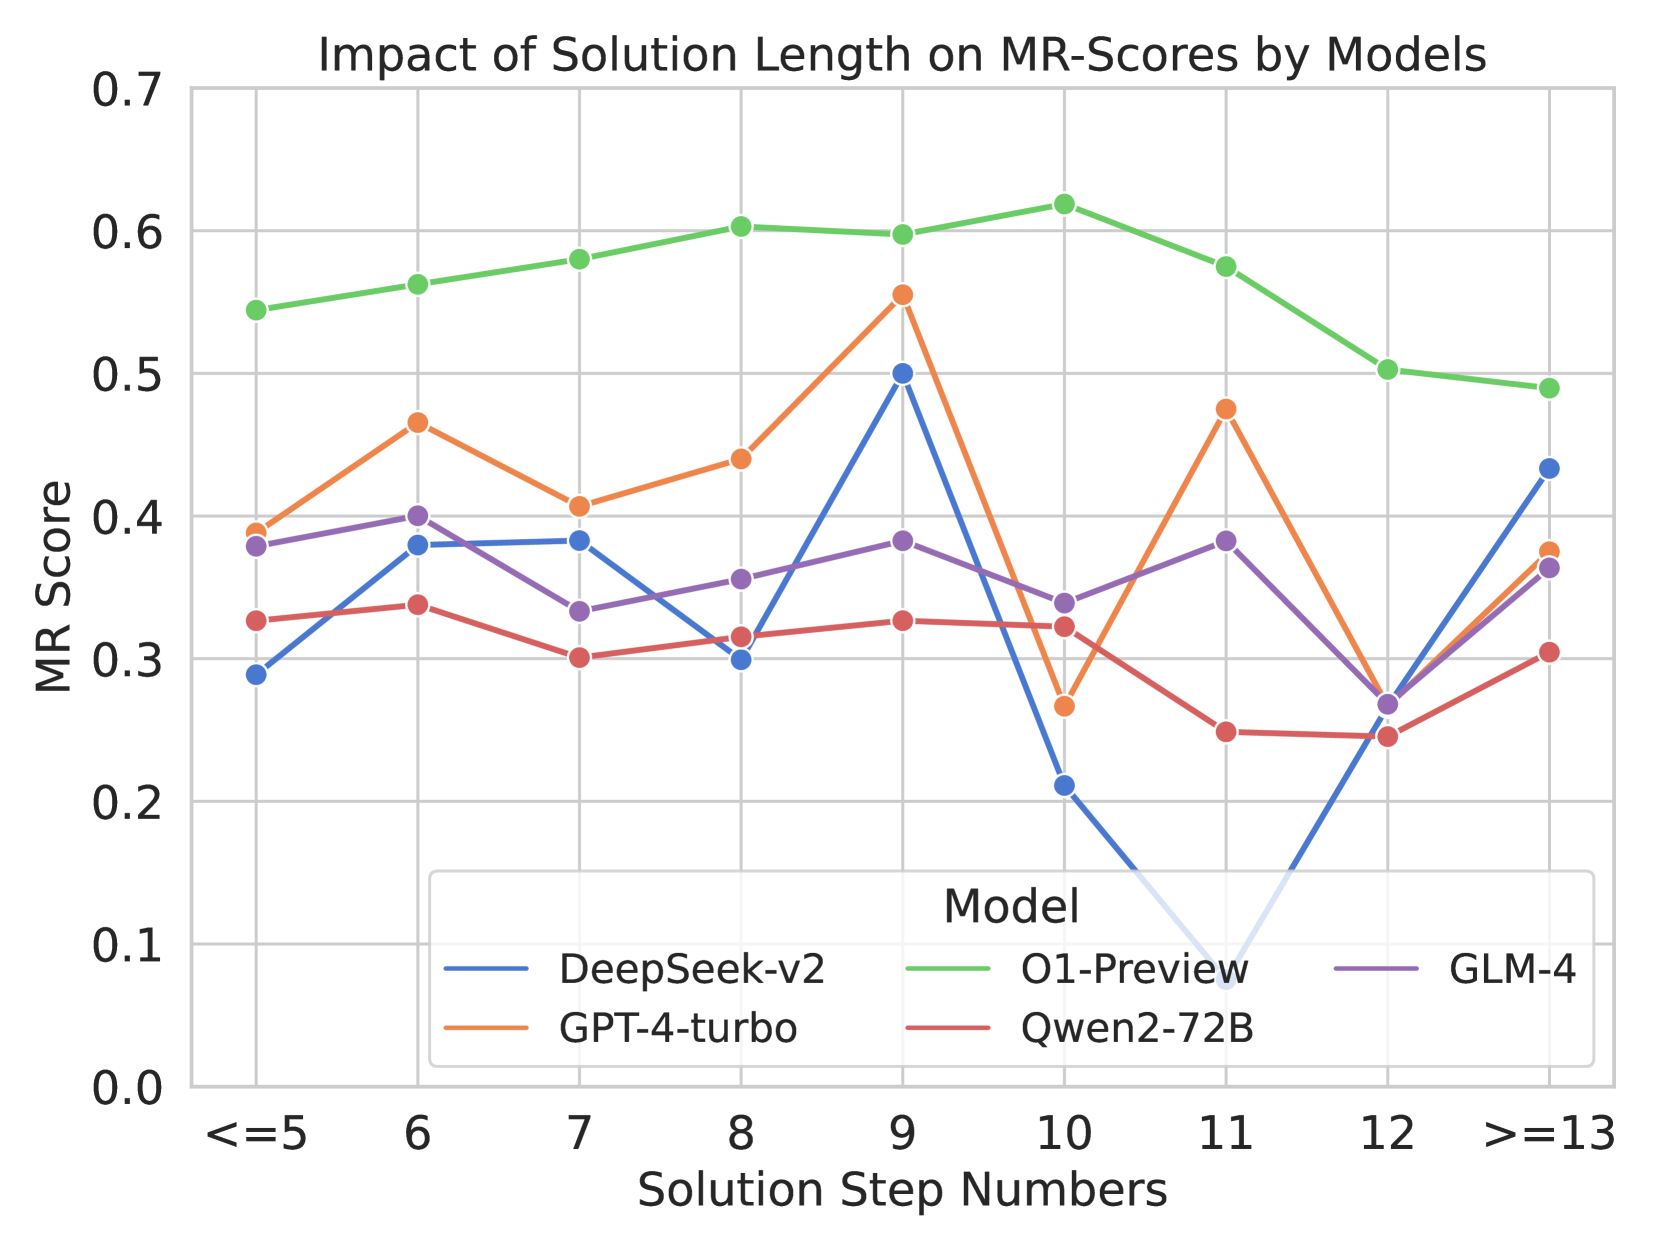
This line chart illustrates the relationship between the number of solution steps and the MR (Metric Reasoning) score achieved by four different models: DeepSeek-v2, GPT-4-turbo, O1-Preview, and GLM-4. The x-axis represents the solution step numbers, categorized into ranges, while the y-axis represents the MR score, ranging from 0.0 to 0.7.
### Components/Axes
* **Title:** "Impact of Solution Length on MR-Scores by Models" (positioned at the top-center)
* **X-axis Label:** "Solution Step Numbers" (positioned at the bottom-center)
* **X-axis Markers:** <=5, 6, 7, 8, 9, 10, 11, 12, >=13
* **Y-axis Label:** "MR Score" (positioned at the left-center)
* **Y-axis Scale:** 0.0 to 0.7, with increments of 0.1
* **Legend:** Located in the bottom-right corner, identifying each line by model name and color.
* **Model Labels & Colors:**
* DeepSeek-v2: Blue
* GPT-4-turbo: Orange
* O1-Preview: Green
* GLM-4: Purple
### Detailed Analysis
The chart displays four distinct lines, each representing a model's MR score as solution step numbers increase.
* **DeepSeek-v2 (Blue):** The line starts at approximately 0.31 for <=5 steps. It decreases to a low of around 0.22 at 10 steps, then sharply increases to approximately 0.42 at >=13 steps. The trend is initially decreasing, then sharply increasing.
* **GPT-4-turbo (Orange):** The line begins at approximately 0.44 for <=5 steps. It generally decreases to a low of around 0.26 at 12 steps, then increases to approximately 0.36 at >=13 steps. The trend is generally decreasing, then increasing.
* **O1-Preview (Green):** The line starts at approximately 0.57 for <=5 steps. It fluctuates between approximately 0.55 and 0.63, with a slight downward trend towards the end, finishing at approximately 0.53 for >=13 steps. The trend is relatively stable, with minor fluctuations.
* **GLM-4 (Purple):** The line begins at approximately 0.39 for <=5 steps. It increases to a peak of approximately 0.52 at 9 steps, then decreases to approximately 0.34 at 12 steps, and finally increases to approximately 0.41 at >=13 steps. The trend is initially increasing, then decreasing, then increasing again.
### Key Observations
* O1-Preview consistently achieves the highest MR scores across all solution step numbers.
* DeepSeek-v2 exhibits the most dramatic change in MR score, with a significant drop followed by a substantial increase.
* GPT-4-turbo shows a consistent, but moderate, decline in MR score until >=13 steps.
* GLM-4 demonstrates a more complex pattern, with an initial increase, a subsequent decrease, and a final increase in MR score.
* The MR scores for all models tend to increase again at the highest solution step number range (>=13).
### Interpretation
The data suggests that the length of the solution process impacts the performance of different models, but the nature of this impact varies significantly. O1-Preview appears to be the most robust model, maintaining high MR scores regardless of the solution length. DeepSeek-v2's performance is highly sensitive to solution length, potentially indicating a need for a specific number of steps to achieve optimal results. GPT-4-turbo's performance declines with increasing solution length, suggesting it may struggle with more complex problems. GLM-4's performance is more nuanced, indicating a potential sweet spot in solution length.
The increase in MR scores for all models at >=13 steps could indicate that longer solution processes eventually lead to improved reasoning, or it could be an artifact of the data or the evaluation metric. The differences in trends between the models suggest that they employ different strategies for problem-solving and have varying sensitivities to the complexity of the task. Further investigation would be needed to understand the underlying reasons for these differences and to determine the optimal solution length for each model.