## Line Chart: Impact of Solution Length on MR-Scores by Models
### Overview
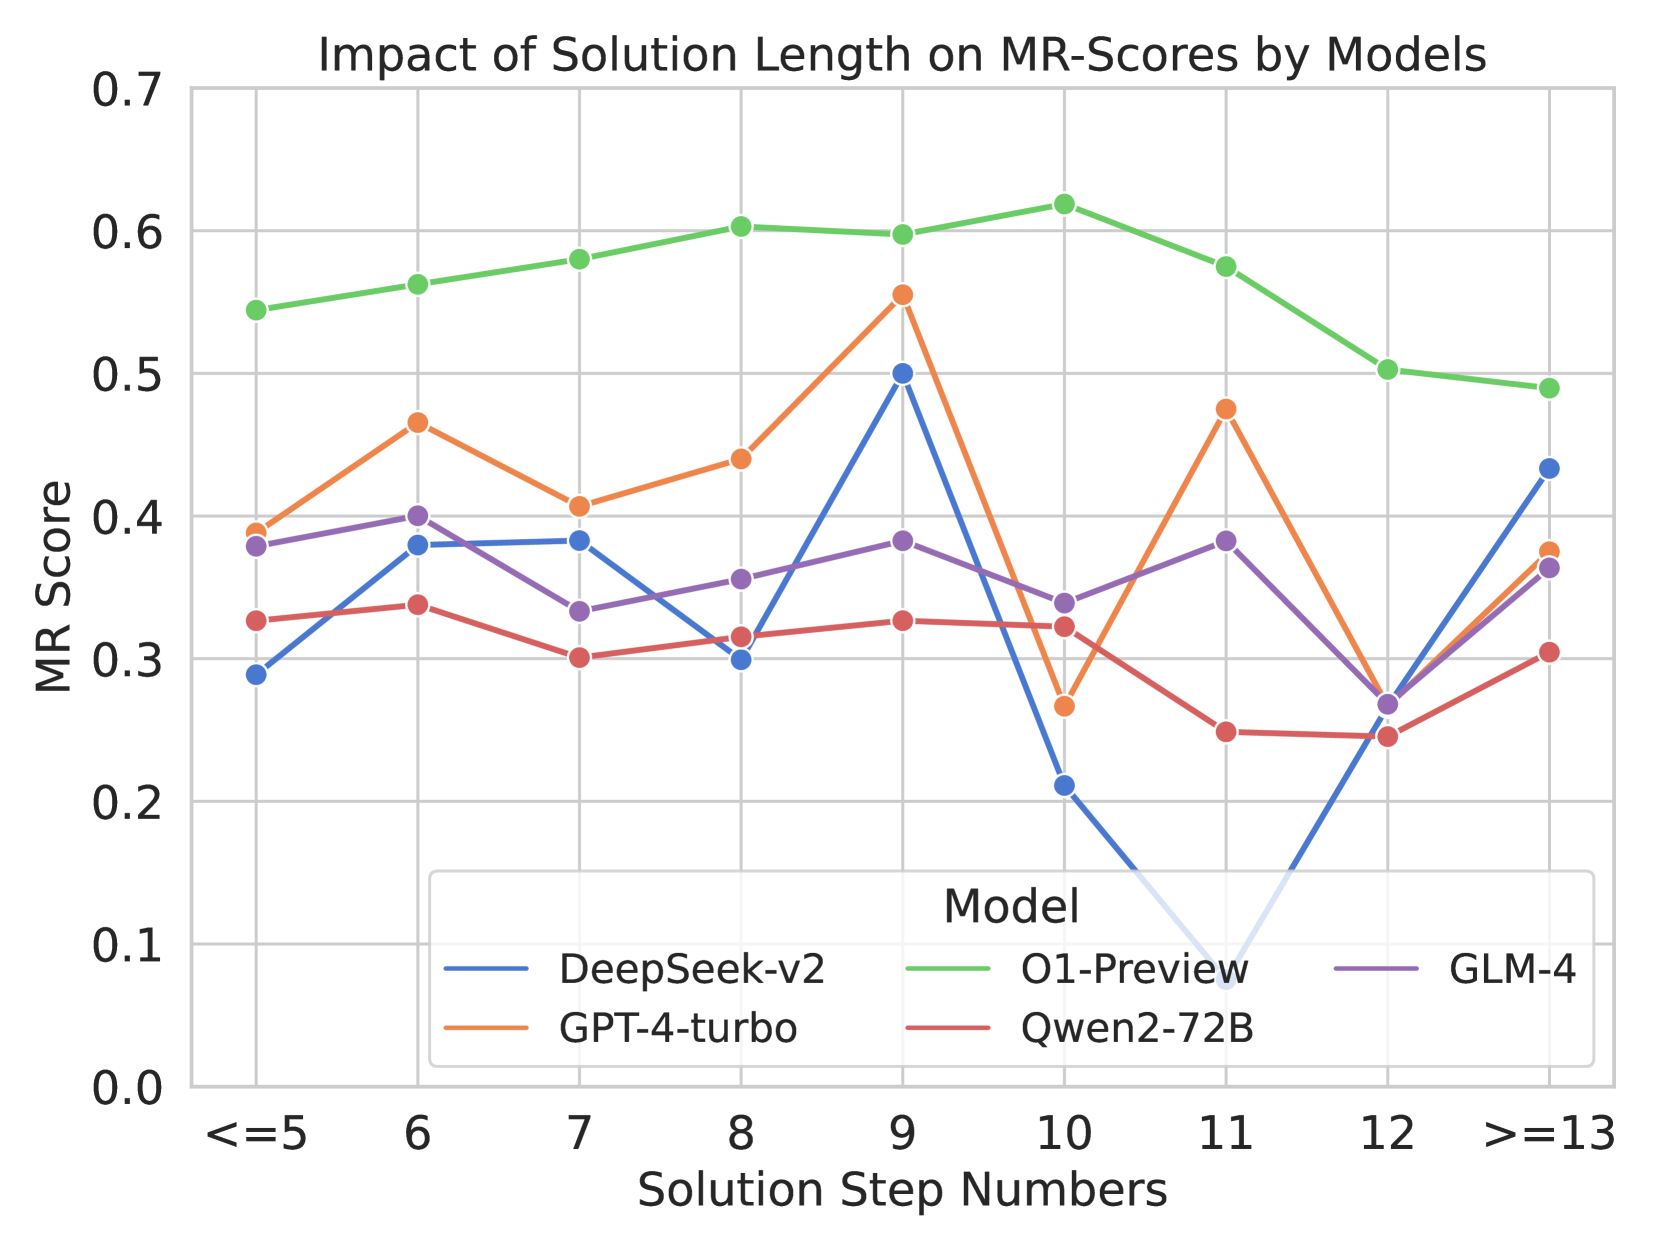
This is a line chart comparing the performance of five different AI models on a metric called "MR Score" across varying solution lengths, measured in "Solution Step Numbers." The chart illustrates how each model's performance changes as the complexity (step count) of the solution increases.
### Components/Axes
* **Title:** "Impact of Solution Length on MR-Scores by Models"
* **Y-Axis:** Labeled "MR Score". The scale runs from 0.0 to 0.7, with major gridlines at intervals of 0.1.
* **X-Axis:** Labeled "Solution Step Numbers". The categories are discrete step counts: `<=5`, `6`, `7`, `8`, `9`, `10`, `11`, `12`, `>=13`.
* **Legend:** Located at the bottom center of the chart, titled "Model". It maps line colors to model names:
* Blue line: **DeepSeek-v2**
* Orange line: **GPT-4-turbo**
* Green line: **O1-Preview**
* Red line: **Qwen2-72B**
* Purple line: **GLM-4**
### Detailed Analysis
Data points are approximate values read from the chart's gridlines.
**1. DeepSeek-v2 (Blue Line)**
* **Trend:** Highly volatile. Starts low, rises to a sharp peak, then plummets dramatically before recovering.
* **Data Points:**
| Step Number | MR Score |
|-------------|----------|
| `<=5` | ~0.29 |
| `6` | ~0.38 |
| `7` | ~0.38 |
| `8` | ~0.30 |
| `9` | ~0.50 (Peak) |
| `10` | ~0.21 (Sharp drop) |
| `11` | ~0.08 (Lowest point, near zero) |
| `12` | ~0.27 |
| `>=13` | ~0.43 |
**2. GPT-4-turbo (Orange Line)**
* **Trend:** Generally upward trend to a peak at step 9, followed by a decline and a final recovery.
* **Data Points:**
| Step Number | MR Score |
|-------------|----------|
| `<=5` | ~0.39 |
| `6` | ~0.47 |
| `7` | ~0.41 |
| `8` | ~0.44 |
| `9` | ~0.56 (Peak) |
| `10` | ~0.27 |
| `11` | ~0.48 |
| `12` | ~0.27 |
| `>=13` | ~0.38 |
**3. O1-Preview (Green Line)**
* **Trend:** Consistently the highest-performing model. Shows a gentle upward trend to a peak at step 10, followed by a gradual decline.
* **Data Points:**
| Step Number | MR Score |
|-------------|----------|
| `<=5` | ~0.55 |
| `6` | ~0.56 |
| `7` | ~0.58 |
| `8` | ~0.60 |
| `9` | ~0.60 |
| `10` | ~0.62 (Peak) |
| `11` | ~0.58 |
| `12` | ~0.50 |
| `>=13` | ~0.49 |
**4. Qwen2-72B (Red Line)**
* **Trend:** The lowest-performing model overall. Relatively flat with minor fluctuations and a notable dip at step 11.
* **Data Points:**
| Step Number | MR Score |
|-------------|----------|
| `<=5` | ~0.33 |
| `6` | ~0.34 |
| `7` | ~0.30 |
| `8` | ~0.31 |
| `9` | ~0.33 |
| `10` | ~0.32 |
| `11` | ~0.25 (Dip) |
| `12` | ~0.25 |
| `>=13` | ~0.30 |
**5. GLM-4 (Purple Line)**
* **Trend:** Moderate performance with a slight downward trend in the middle steps, followed by a recovery.
* **Data Points:**
| Step Number | MR Score |
|-------------|----------|
| `<=5` | ~0.38 |
| `6` | ~0.40 |
| `7` | ~0.33 |
| `8` | ~0.36 |
| `9` | ~0.38 |
| `10` | ~0.34 |
| `11` | ~0.38 |
| `12` | ~0.27 (Dip) |
| `>=13` | ~0.37 |
### Key Observations
1. **Performance Hierarchy:** O1-Preview (green) maintains a clear lead across almost all step counts. Qwen2-72B (red) is consistently at the bottom.
2. **Critical Step Count:** Step `9` appears to be a point of high performance for several models (DeepSeek-v2, GPT-4-turbo, GLM-4), suggesting a potential "sweet spot" in solution complexity for these systems.
3. **Volatility:** DeepSeek-v2 exhibits extreme volatility, with a catastrophic drop in performance at steps `10` and `11` before a strong recovery. This indicates a potential fragility or specific weakness at those solution lengths.
4. **Convergence at Extremes:** At the shortest (`<=5`) and longest (`>=13`) solution lengths, the performance gap between models narrows compared to the middle steps.
5. **Anomaly:** The sharp, synchronized dip for GPT-4-turbo and DeepSeek-v2 at step `10` is notable, while O1-Preview peaks at this same point.
### Interpretation
The data suggests that **solution length (complexity) has a non-linear and model-specific impact on MR-Score performance.** There is no universal "longer is better" or "shorter is better" rule.
* **O1-Preview** demonstrates robust and superior performance, peaking at a moderately high complexity (10 steps) before a graceful decline. This implies strong generalization across problem difficulties.
* The **volatility of DeepSeek-v2** suggests its reasoning or scoring mechanism may be highly sensitive to specific structural features present in solutions of 10-11 steps, leading to a breakdown. Its recovery at `>=13` steps is intriguing and warrants investigation.
* The **peak at step 9** for multiple models could indicate that problems requiring around nine steps represent a balance where models can apply their reasoning capabilities most effectively before the complexity becomes overwhelming.
* The **consistent underperformance of Qwen2-72B** across all lengths indicates a fundamental gap in capability on this specific MR metric compared to the other models tested.
In summary, this chart is crucial for understanding model reliability. It shows that evaluating a model only on average performance or at a single complexity level can be misleading. The choice of the "best" model may depend heavily on the expected difficulty (step count) of the tasks in a given application.