## Line Chart: Impact of Solution Length on MR-Scores by Models
### Overview
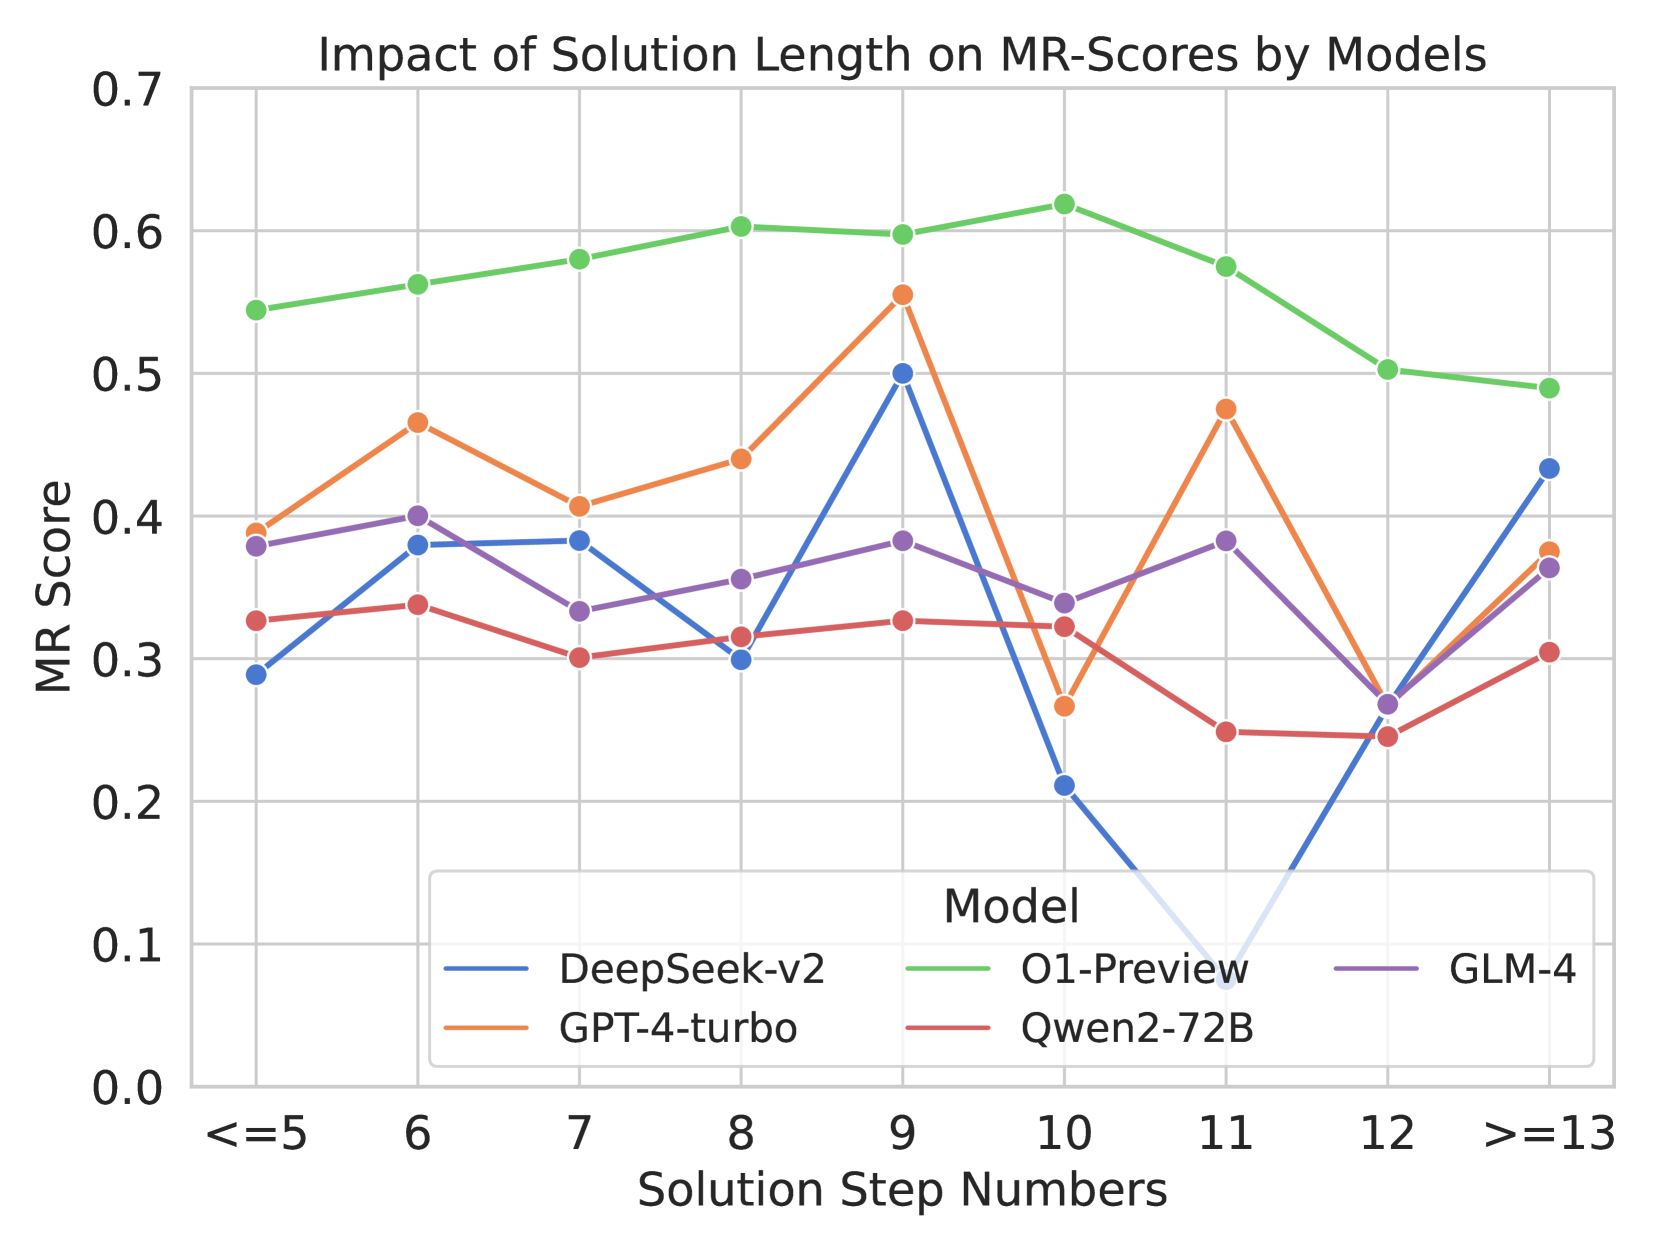
The chart visualizes the relationship between solution length (measured in step numbers) and MR-Scores across four AI models: DeepSeek-v2, O1-Preview, GPT-4-turbo, and Qwen2-72B. MR-Scores range from 0.0 to 0.7, with solution steps categorized into discrete bins (<=5, 6–12, >13). Each model's performance is represented by a distinct colored line, showing trends in score stability or variability as solution complexity increases.
---
### Components/Axes
- **X-Axis (Solution Step Numbers)**:
- Categories: `<=5`, `6`, `7`, `8`, `9`, `10`, `11`, `12`, `>=13`
- Labels: Discrete step bins, with `>=13` representing aggregated data for steps 13+.
- **Y-Axis (MR Score)**:
- Scale: 0.0 to 0.7 in increments of 0.1.
- **Legend**:
- Position: Bottom-right corner.
- Mappings:
- Blue: DeepSeek-v2
- Green: O1-Preview
- Orange: GPT-4-turbo
- Red: Qwen2-72B
---
### Detailed Analysis
1. **O1-Preview (Green Line)**:
- **Trend**: Starts at ~0.55 for `<=5` steps, peaks at **0.62** for `10` steps, then declines to ~0.50 for `>=13` steps.
- **Key Data Points**:
- `<=5`: 0.55
- `6`: 0.57
- `7`: 0.59
- `8`: 0.61
- `9`: 0.60
- `10`: 0.62
- `11`: 0.58
- `12`: 0.50
- `>=13`: 0.49
2. **DeepSeek-v2 (Blue Line)**:
- **Trend**: Starts at ~0.30 for `<=5`, rises to **0.50** at `9` steps, crashes to **0.10** at `11` steps, then recovers to ~0.45 at `>=13`.
- **Key Data Points**:
- `<=5`: 0.30
- `6`: 0.38
- `7`: 0.39
- `8`: 0.31
- `9`: 0.50
- `10`: 0.20
- `11`: 0.10
- `12`: 0.25
- `>=13`: 0.45
3. **GPT-4-turbo (Orange Line)**:
- **Trend**: Peaks at **0.55** for `9` steps, with a sharp drop to **0.28** at `10` steps. Recovers to ~0.45 at `>=13`.
- **Key Data Points**:
- `<=5`: 0.40
- `6`: 0.47
- `7`: 0.41
- `8`: 0.45
- `9`: 0.55
- `10`: 0.28
- `11`: 0.48
- `12`: 0.25
- `>=13`: 0.38
4. **Qwen2-72B (Red Line)**:
- **Trend**: Relatively stable, with minor fluctuations. Dips to **0.25** at `12` steps.
- **Key Data Points**:
- `<=5`: 0.33
- `6`: 0.35
- `7`: 0.30
- `8`: 0.32
- `9`: 0.33
- `10`: 0.32
- `11`: 0.25
- `12`: 0.25
- `>=13`: 0.31
---
### Key Observations
1. **O1-Preview Dominance**: Consistently highest scores across most step bins, suggesting superior robustness in handling longer solutions.
2. **DeepSeek-v2 Anomaly**: Dramatic drop to 0.10 at `11` steps, followed by recovery. Indicates potential instability or overfitting at intermediate solution lengths.
3. **GPT-4-turbo Volatility**: Sharp decline from 0.55 (step 9) to 0.28 (step 10), then partial recovery. Suggests sensitivity to step count thresholds.
4. **Qwen2-72B Stability**: Lowest variance but also lowest scores, implying conservative performance trade-offs.
---
### Interpretation
- **Model Performance**: O1-Preview’s peak at `10` steps aligns with its likely optimization for complex reasoning tasks. DeepSeek-v2’s anomaly at `11` steps may reflect architectural limitations in scaling.
- **Solution Length Impact**: Scores generally decline for `>=13` steps, suggesting diminishing returns or increased error rates with excessive complexity.
- **Outliers**: DeepSeek-v2’s `11`-step crash and GPT-4-turbo’s `10`-step drop highlight model-specific vulnerabilities.
- **Practical Implications**: O1-Preview is optimal for high-stakes tasks requiring long solutions, while Qwen2-72B may suit simpler, stable applications.