## Line Chart: Accuracy vs. Time for Different Parameters
### Overview
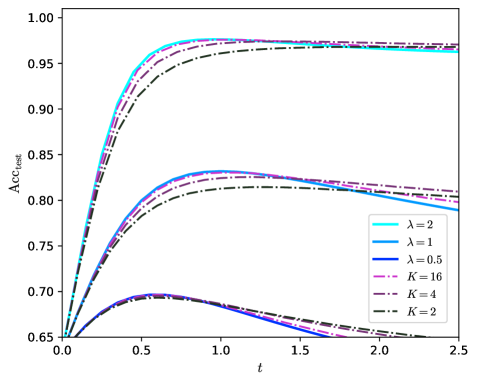
The image is a line chart showing the test accuracy (Acc_test) as a function of time (t) for different values of parameters lambda (λ) and K. There are three lines representing different values of λ (2, 1, and 0.5) and three lines representing different values of K (16, 4, and 2). The chart illustrates how these parameters affect the accuracy of a model over time.
### Components/Axes
* **Y-axis (Vertical):** Acc_test (Test Accuracy). Scale ranges from 0.65 to 1.00, with tick marks at 0.65, 0.70, 0.75, 0.80, 0.85, 0.90, 0.95, and 1.00.
* **X-axis (Horizontal):** t (Time). Scale ranges from 0.0 to 2.5, with tick marks at 0.0, 0.5, 1.0, 1.5, 2.0, and 2.5.
* **Legend (Right Side):**
* Light Blue: λ = 2
* Blue: λ = 1
* Dark Blue: λ = 0.5
* Purple Dashed: K = 16
* Gray Dashed: K = 4
* Black Dashed: K = 2
### Detailed Analysis
* **λ = 2 (Light Blue):** This line starts at approximately 0.65 and rises sharply to approximately 0.97 by t = 0.5, then plateaus and remains relatively constant around 0.97 until t = 2.5.
* **λ = 1 (Blue):** This line starts at approximately 0.65 and rises sharply to approximately 0.96 by t = 0.5, then plateaus and remains relatively constant around 0.96 until t = 2.5.
* **λ = 0.5 (Dark Blue):** This line starts at approximately 0.65 and rises sharply to approximately 0.95 by t = 0.5, then plateaus and remains relatively constant around 0.95 until t = 2.5.
* **K = 16 (Purple Dashed):** This line starts at approximately 0.65 and rises sharply to approximately 0.83 by t = 0.5, then decreases slightly to approximately 0.80 by t = 2.5.
* **K = 4 (Gray Dashed):** This line starts at approximately 0.65 and rises sharply to approximately 0.82 by t = 0.5, then decreases slightly to approximately 0.79 by t = 2.5.
* **K = 2 (Black Dashed):** This line starts at approximately 0.65 and rises sharply to approximately 0.70 by t = 0.5, then decreases slightly to approximately 0.66 by t = 2.5.
### Key Observations
* The lines representing different values of λ (2, 1, and 0.5) all exhibit a similar trend: a rapid increase in accuracy followed by a plateau. The higher the value of λ, the higher the plateau.
* The lines representing different values of K (16, 4, and 2) also exhibit a similar trend: a rapid increase in accuracy followed by a slight decrease. The higher the value of K, the higher the peak accuracy.
* The accuracy for λ values is significantly higher than the accuracy for K values.
### Interpretation
The chart suggests that the parameter λ has a more significant impact on the final test accuracy compared to the parameter K. Higher values of λ lead to higher and more stable accuracy over time. The parameter K, while initially increasing accuracy, seems to cause a slight decrease in accuracy as time progresses. This could indicate that higher values of K might lead to overfitting over time. The model performs significantly better with the tested λ parameters than with the tested K parameters.