\n
## Line Chart: Test Accuracy vs. Time
### Overview
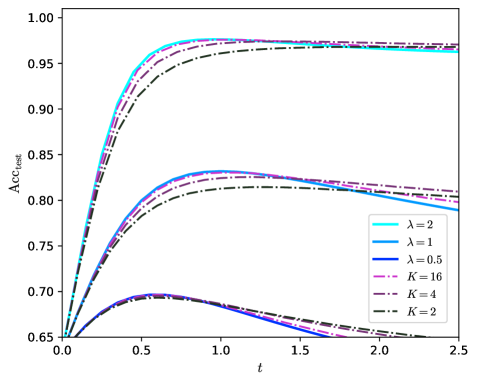
The image presents a line chart illustrating the relationship between test accuracy (Acc<sub>test</sub>) and time (t) for different parameter settings. Several lines represent different values of lambda (λ) and K, showing how test accuracy evolves over time.
### Components/Axes
* **X-axis:** Labeled "t", representing time. The scale ranges from approximately 0.0 to 2.5.
* **Y-axis:** Labeled "Acc<sub>test</sub>", representing test accuracy. The scale ranges from approximately 0.65 to 1.00.
* **Legend:** Located in the top-right corner, containing the following lines and their corresponding parameters:
* λ = 2 (Cyan) - Solid Line
* λ = 1 (Blue) - Solid Line
* λ = 0.5 (Dark Blue) - Solid Line
* K = 16 (Magenta) - Dashed Line
* K = 4 (Purple) - Dashed Line
* K = 2 (Dark Grey) - Dashed Line
### Detailed Analysis
Here's a breakdown of each line's trend and approximate data points:
* **λ = 2 (Cyan):** The line slopes sharply upward initially, reaching approximately 0.95 at t = 0.5, and then plateaus, remaining around 0.96-0.97 for t > 1.0.
* **λ = 1 (Blue):** This line also slopes upward, but less steeply than λ = 2. It reaches approximately 0.92 at t = 0.5, and plateaus around 0.94-0.95 for t > 1.0.
* **λ = 0.5 (Dark Blue):** This line exhibits a slower initial increase compared to λ = 1 and λ = 2. It reaches approximately 0.85 at t = 0.5, and plateaus around 0.88-0.90 for t > 1.0.
* **K = 16 (Magenta):** The line starts at approximately 0.67 at t = 0.0, increases moderately, reaching around 0.85 at t = 0.5, and then plateaus around 0.87-0.88 for t > 1.0.
* **K = 4 (Purple):** This line begins at approximately 0.68 at t = 0.0, increases more slowly than K = 16, reaching around 0.78 at t = 0.5, and plateaus around 0.80-0.82 for t > 1.0.
* **K = 2 (Dark Grey):** This line has the slowest initial increase, starting at approximately 0.66 at t = 0.0, reaching around 0.72 at t = 0.5, and plateaus around 0.74-0.76 for t > 1.0.
### Key Observations
* Higher values of λ (2 and 1) lead to faster convergence to higher test accuracy.
* Higher values of K (16 and 4) result in higher test accuracy compared to lower values (2), but the convergence is slower.
* The lines representing different parameter settings all appear to converge to a stable accuracy level as time increases.
* The lines for K = 2 and K = 4 are very close together, suggesting that the impact of K diminishes beyond a certain point.
### Interpretation
The chart demonstrates the impact of parameters λ and K on the test accuracy of a model over time. The parameter λ appears to control the speed of learning, with higher values leading to faster convergence. The parameter K seems to influence the ultimate achievable accuracy, with higher values resulting in better performance. The plateauing of the lines suggests that the model reaches a point of diminishing returns, where further training does not significantly improve accuracy. This could indicate that the model has converged or that other factors are limiting performance. The differences in the curves suggest that the optimal values of λ and K depend on the specific application and desired trade-off between learning speed and final accuracy.