## Line Chart: Test Accuracy vs. Parameter `t` for Different Model Configurations
### Overview
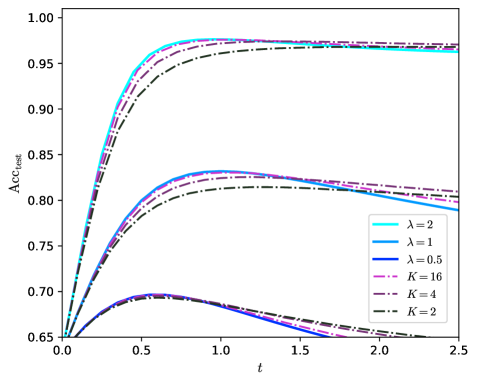
The image is a line chart plotting test accuracy (`Acc_test`) against a parameter `t`. It displays six distinct curves, grouped into three performance tiers, representing different model configurations defined by parameters `λ` (lambda) and `K`. The chart demonstrates how test accuracy evolves as `t` increases for each configuration.
### Components/Axes
* **Y-Axis:** Labeled `Acc_test`. Scale ranges from 0.65 to 1.00, with major tick marks at 0.05 intervals (0.65, 0.70, 0.75, 0.80, 0.85, 0.90, 0.95, 1.00).
* **X-Axis:** Labeled `t`. Scale ranges from 0.0 to 2.5, with major tick marks at 0.5 intervals (0.0, 0.5, 1.0, 1.5, 2.0, 2.5).
* **Legend:** Located in the bottom-right quadrant of the chart area. It defines six data series:
* `λ = 2`: Cyan solid line.
* `λ = 1`: Blue solid line.
* `λ = 0.5`: Dark blue solid line.
* `K = 16`: Magenta dash-dot line.
* `K = 4`: Purple dash-dot line.
* `K = 2`: Black dash-dot line.
### Detailed Analysis
The six curves form three distinct clusters based on their peak accuracy and overall trajectory.
**1. High-Performance Cluster (Peak Acc_test ≈ 0.97 - 0.98):**
* **Trend:** All curves in this group rise very steeply from `t=0`, begin to plateau around `t=0.75`, and maintain a high, nearly flat accuracy for `t > 1.0`.
* **Data Series & Points (Approximate):**
* `λ = 2` (Cyan): Reaches the highest peak (~0.98) around `t=1.0`. Slight decline to ~0.97 by `t=2.5`.
* `K = 16` (Magenta): Very closely follows `λ=2`, peaking at ~0.975. Ends near ~0.97.
* `λ = 1` (Blue): Peaks at ~0.97. Shows a very slight downward trend after `t=1.5`, ending near ~0.965.
* `K = 4` (Purple): Peaks at ~0.965. Follows a similar slight decline as `λ=1`.
* `K = 2` (Black): The lowest in this cluster. Peaks at ~0.96 and declines to ~0.95 by `t=2.5`.
**2. Mid-Performance Cluster (Peak Acc_test ≈ 0.82 - 0.83):**
* **Trend:** Curves rise to a peak between `t=0.75` and `t=1.0`, then exhibit a clear, gradual decline as `t` increases further.
* **Data Series & Points (Approximate):**
* `λ = 0.5` (Dark Blue): Peaks at ~0.83 around `t=0.9`. Declines to ~0.79 by `t=2.5`.
* The magenta (`K=16`), purple (`K=4`), and black (`K=2`) dash-dot lines also have representatives in this cluster, following nearly identical paths to the `λ=0.5` line, making them difficult to distinguish. They all peak near 0.82-0.83 and decline to ~0.78-0.79.
**3. Low-Performance Cluster (Peak Acc_test ≈ 0.69 - 0.70):**
* **Trend:** Curves rise to a relatively low peak around `t=0.6`, then decline sharply and continuously.
* **Data Series & Points (Approximate):**
* This cluster appears to contain the lower counterparts of the `K` series (likely `K=4` and `K=2` based on line style), though the legend mapping is ambiguous here due to overlap. The peak is approximately 0.69-0.70. By `t=2.5`, accuracy has fallen to near or below the starting value of 0.65.
### Key Observations
1. **Clear Stratification:** Performance is strongly stratified into three distinct bands, suggesting the parameters `λ` and `K` have a categorical impact on model accuracy.
2. **Parameter Sensitivity:** Higher values of `λ` (2, 1) and `K` (16) are associated with the high-performance cluster. Lower values (`λ=0.5`, `K=2`) are associated with mid or low performance.
3. **Optimal `t` Range:** For high-performing models, accuracy peaks and stabilizes for `t` between approximately 0.75 and 1.5. For lower-performing models, accuracy degrades after a peak at a lower `t` value (~0.6-0.9).
4. **Line Style Correlation:** Solid lines (`λ` series) and dash-dot lines (`K` series) are present in multiple performance clusters, indicating that both parameter types influence the outcome, but their specific value is the primary determinant of the performance tier.
### Interpretation
This chart likely visualizes the results of a machine learning or optimization experiment where `t` represents a training duration, regularization strength, or a similar continuous hyperparameter. `Acc_test` is the model's generalization performance.
The data suggests a strong interaction between the parameters `λ`/`K` and `t`. **High values of `λ` or `K` enable models to achieve superior accuracy that is robust to increases in `t` beyond an optimal point.** In contrast, models with low `λ` or `K` are not only less accurate but also more sensitive to `t`, suffering from performance degradation (possibly overfitting or instability) as `t` grows large.
The clustering implies that `λ` and `K` might control similar underlying mechanisms (e.g., model capacity, regularization, or ensemble size), where crossing a certain threshold (e.g., `λ >= 1` or `K >= 16`) unlocks a significantly better and more stable performance regime. The near-overlap of curves within clusters suggests that within a regime, the exact value of `t` (beyond the minimum) is less critical than the choice of `λ` or `K`.