## Chart: AIME-24 Accuracy vs (binned) Length of Thoughts
### Overview
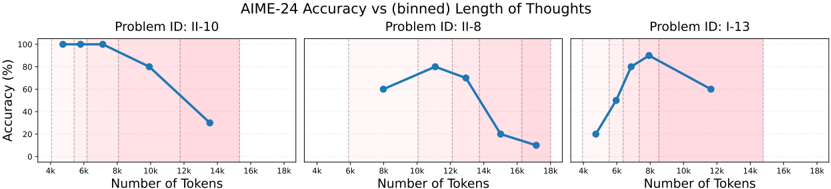
The image presents three line charts comparing the accuracy of AIME-24 problem-solving against the length of "thoughts" (measured in tokens). Each chart corresponds to a different problem ID: II-10, II-8, and I-13. The x-axis represents the number of tokens, and the y-axis represents the accuracy in percentage. Each chart has a shaded red region towards the right side.
### Components/Axes
* **Title:** AIME-24 Accuracy vs (binned) Length of Thoughts
* **X-axis Title:** Number of Tokens
* Scale: 4k, 6k, 8k, 10k, 12k, 14k, 16k, 18k
* **Y-axis Title:** Accuracy (%)
* Scale: 0, 20, 40, 60, 80, 100
* **Problem IDs (Chart Titles):**
* Problem ID: II-10 (left)
* Problem ID: II-8 (center)
* Problem ID: I-13 (right)
* **Shaded Region:** Each chart has a shaded red region on the right side, starting around 12k-14k tokens and extending to 18k tokens.
### Detailed Analysis
**Chart 1: Problem ID: II-10**
* **Trend:** The accuracy starts at 100% and generally decreases as the number of tokens increases.
* **Data Points:**
* 4k tokens: 100%
* 6k tokens: 100%
* 8k tokens: Approximately 90%
* 10k tokens: Approximately 80%
* 13k tokens: Approximately 30%
**Chart 2: Problem ID: II-8**
* **Trend:** The accuracy initially increases, reaches a peak, and then decreases significantly.
* **Data Points:**
* 8k tokens: Approximately 60%
* 11k tokens: Approximately 80%
* 13k tokens: Approximately 75%
* 15k tokens: Approximately 20%
* 17k tokens: Approximately 10%
**Chart 3: Problem ID: I-13**
* **Trend:** The accuracy increases to a peak and then decreases.
* **Data Points:**
* 5k tokens: Approximately 20%
* 7k tokens: Approximately 50%
* 8k tokens: Approximately 90%
* 9k tokens: Approximately 85%
* 11k tokens: Approximately 60%
### Key Observations
* For Problem II-10, longer "thoughts" correlate with lower accuracy.
* For Problems II-8 and I-13, there appears to be an optimal "thought" length, beyond which accuracy decreases.
* The red shaded region seems to indicate a range of token lengths where accuracy tends to be lower, especially for problems II-8 and I-13.
### Interpretation
The charts suggest that the length of "thoughts" (as measured by the number of tokens) has a varying impact on the accuracy of solving AIME-24 problems. For some problems (like II-10), brevity seems to be beneficial. For others (like II-8 and I-13), there's an optimal length, suggesting that too short or too long "thoughts" can hinder performance. The red shaded region might indicate a range of token lengths that are generally less effective for these problems. This could be due to the model getting lost in irrelevant details or overthinking the problem.