\n
## Line Chart: AIME-24 Accuracy vs (binned) Length of Thoughts
### Overview
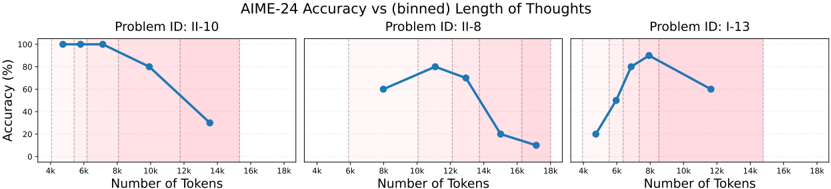
The image presents three separate line charts, each displaying the relationship between AIME-24 accuracy (in percentage) and the number of tokens used, binned into intervals. Each chart corresponds to a different problem ID: II-10, II-8, and I-13. The charts aim to visualize how accuracy changes with varying token lengths for each problem.
### Components/Axes
* **Title:** AIME-24 Accuracy vs (binned) Length of Thoughts
* **X-axis Label:** Number of Tokens
* **Y-axis Label:** Accuracy (%)
* **X-axis Markers:** 4k, 8k, 12k, 14k, 18k
* **Y-axis Scale:** 0% to 100%
* **Problem IDs:** II-10, II-8, I-13 (displayed above each chart)
* **Data Series:** A single blue line for each problem ID.
### Detailed Analysis or Content Details
**Chart 1: Problem ID: II-10**
* **Trend:** The line slopes downward, indicating a decrease in accuracy as the number of tokens increases.
* **Data Points (approximate):**
* 4k Tokens: ~98%
* 8k Tokens: ~85%
* 12k Tokens: ~65%
* 14k Tokens: ~45%
* 18k Tokens: ~30%
**Chart 2: Problem ID: II-8**
* **Trend:** The line initially increases, reaches a peak, and then decreases, forming an inverted U-shape.
* **Data Points (approximate):**
* 4k Tokens: ~50%
* 8k Tokens: ~60%
* 12k Tokens: ~70%
* 14k Tokens: ~60%
* 18k Tokens: ~15%
**Chart 3: Problem ID: I-13**
* **Trend:** The line increases to a peak and then decreases, similar to Chart 2, but with a different peak location.
* **Data Points (approximate):**
* 4k Tokens: ~30%
* 8k Tokens: ~45%
* 12k Tokens: ~75%
* 14k Tokens: ~60%
* 18k Tokens: ~50%
### Key Observations
* Problem II-10 shows a consistent decrease in accuracy with increasing tokens.
* Problems II-8 and I-13 exhibit an optimal token length where accuracy is maximized. Beyond this point, accuracy declines.
* The optimal token length differs between problems II-8 and I-13.
* The accuracy values vary significantly across the three problems.
### Interpretation
The data suggests that there is not a universally optimal token length for AIME-24 problems. The relationship between token length and accuracy is problem-dependent. For some problems (like II-10), increasing the number of tokens consistently reduces accuracy, potentially indicating that the model is being over-constrained or distracted by irrelevant information. For other problems (II-8 and I-13), there's a sweet spot where a moderate number of tokens leads to the best performance. This could be because the model needs a certain amount of context to understand the problem, but too much context becomes detrimental. The differences in accuracy across problems suggest that the complexity or nature of the problems themselves influence the optimal token length. The inverted U-shape observed in charts II-8 and I-13 could indicate that the model benefits from a certain level of reasoning depth (represented by the number of tokens) but suffers from diminishing returns or increased noise beyond that point.