## Line Chart: AIME-24 Accuracy vs (binned) Length of Thoughts
### Overview
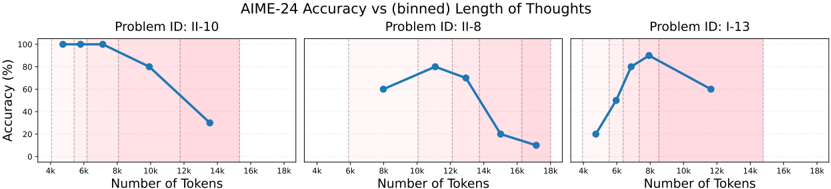
The image displays three line charts comparing accuracy (%) against the number of tokens (x-axis) for three distinct AIME-24 problems (II-10, II-8, I-13). Each subplot includes a blue line with data points and shaded pink regions highlighting specific token ranges. Accuracy declines generally with increasing token count, but trends vary by problem.
---
### Components/Axes
- **Main Title**: "AIME-24 Accuracy vs (binned) Length of Thoughts"
- **Y-Axis**: "Accuracy (%)" (0% to 100%, linear scale)
- **X-Axis**: "Number of Tokens" (4k to 18k, binned in 2k increments)
- **Subplot Titles**:
- Top-left: "Problem ID: II-10"
- Top-center: "Problem ID: II-8"
- Top-right: "Problem ID: I-13"
- **Shaded Regions**: Pink areas indicating critical token ranges (see Detailed Analysis).
---
### Detailed Analysis
#### Problem ID: II-10
- **Data Points**:
- 4k tokens: 100% accuracy
- 6k tokens: 100% accuracy
- 8k tokens: 100% accuracy
- 10k tokens: 80% accuracy
- 12k tokens: 60% accuracy
- 14k tokens: 30% accuracy
- **Trend**: Sharp decline after 6k tokens, with a steep drop from 80% (10k) to 30% (14k). Shaded region spans 10k–14k tokens.
#### Problem ID: II-8
- **Data Points**:
- 8k tokens: 60% accuracy
- 10k tokens: 80% accuracy
- 12k tokens: 70% accuracy
- 14k tokens: 20% accuracy
- 16k tokens: 10% accuracy
- **Trend**: Initial rise to 80% at 10k, followed by a steep decline to 10% at 16k. Shaded region spans 8k–16k tokens.
#### Problem ID: I-13
- **Data Points**:
- 4k tokens: 20% accuracy
- 6k tokens: 50% accuracy
- 8k tokens: 80% accuracy
- 10k tokens: 70% accuracy
- 12k tokens: 60% accuracy
- **Trend**: Rapid rise to 80% at 8k, then gradual decline to 60% at 12k. Shaded region spans 8k–12k tokens.
---
### Key Observations
1. **General Trend**: Accuracy decreases as token count increases, but with problem-specific anomalies.
2. **Peaks**:
- II-10: Maintains 100% accuracy until 8k tokens.
- II-8: Peaks at 80% at 10k tokens before collapsing.
- I-13: Sharp rise to 80% at 8k tokens.
3. **Shaded Regions**: Highlight critical ranges where accuracy drops significantly (e.g., II-8’s 8k–16k range shows a 70% drop from peak to trough).
---
### Interpretation
- **Model Behavior**: Longer token sequences correlate with reduced accuracy, suggesting diminishing returns or computational limits. However, specific token thresholds (e.g., 8k for I-13, 10k for II-8) may represent optimal or transitional points.
- **Shaded Regions**: Likely indicate ranges where the model’s performance is analyzed for failure modes or inefficiencies. For example, II-8’s 8k–16k range shows a 70% accuracy drop, signaling a critical failure zone.
- **Anomalies**: II-10’s sustained 100% accuracy until 8k tokens contrasts with other problems, possibly indicating problem-specific robustness or data sparsity.
The data underscores the importance of token efficiency in model performance, with problem-specific optimal ranges requiring further investigation.