# Model Performance Comparison
## Chart Description
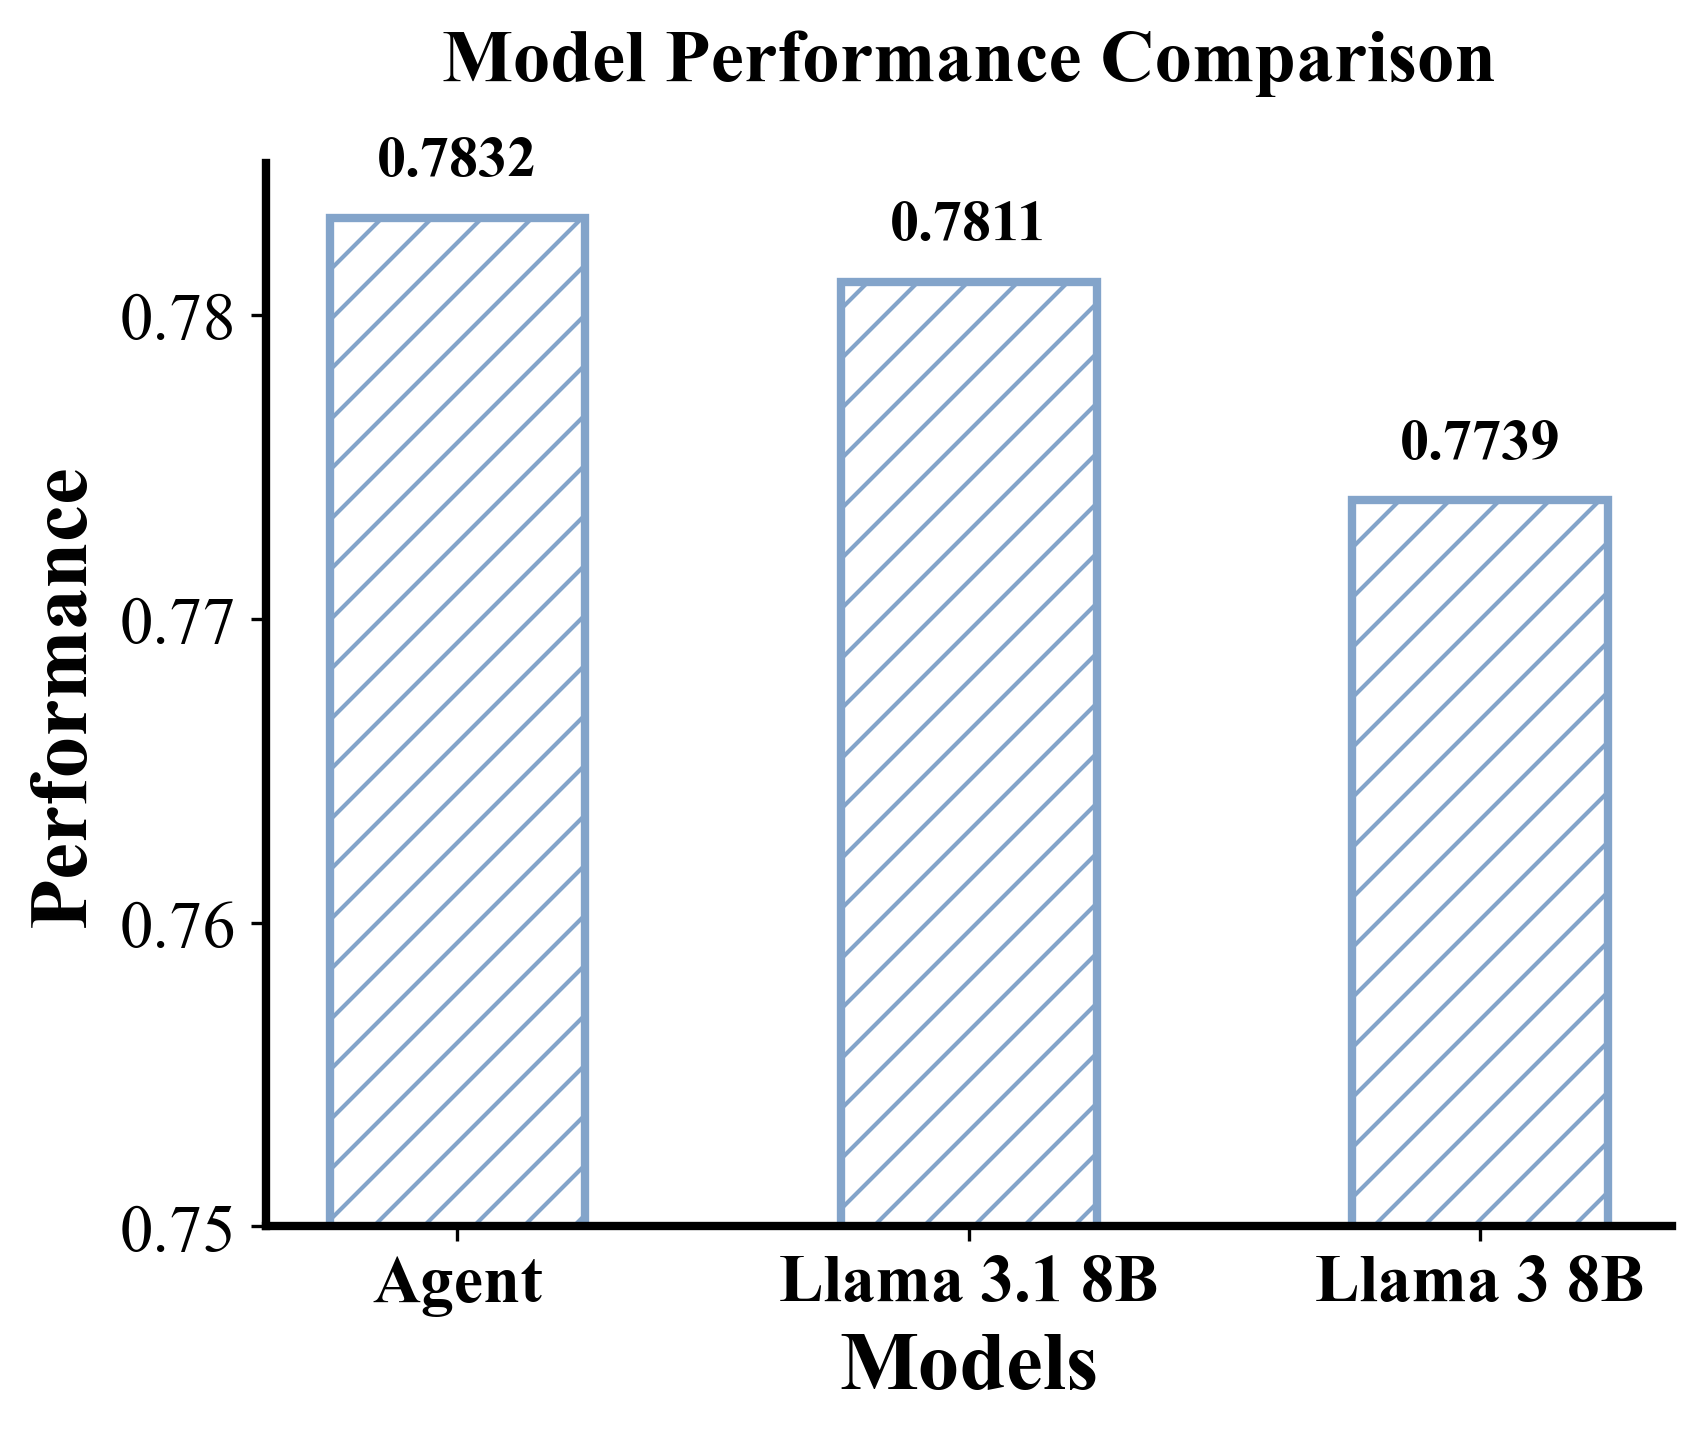
This image presents a **bar chart** comparing the performance of three models. The chart uses **diagonal shading** for visual distinction but does not include a legend. All textual elements are in **English**.
---
### Key Components
1. **Title**:
- "Model Performance Comparison" (centered at the top).
2. **Axes**:
- **X-axis**: Labeled "Models" with three categories:
- Agent
- Llama 3.1 8B
- Llama 3 8B
- **Y-axis**: Labeled "Performance" with values ranging from **0.75** to **0.78** in increments of **0.01**.
3. **Data Points**:
- **Agent**: Performance = **0.7832** (highest value).
- **Llama 3.1 8B**: Performance = **0.7811**.
- **Llama 3 8B**: Performance = **0.7739** (lowest value).
4. **Visual Trends**:
- The bars are ordered left-to-right as: **Agent > Llama 3.1 8B > Llama 3 8B**.
- Performance decreases progressively from left to right.
5. **Shading**:
- All bars feature **diagonal blue stripes** for visual differentiation.
---
### Notes
- **No legend** is present to explain the shading pattern.
- The chart focuses solely on performance metrics, with no additional annotations or contextual text.
- All values are explicitly labeled on top of their respective bars.
This chart emphasizes the relative performance differences between the three models, with the "Agent" model achieving the highest score.