## Bar Chart: Latency vs. Batch Size for FP16 and INT8
### Overview
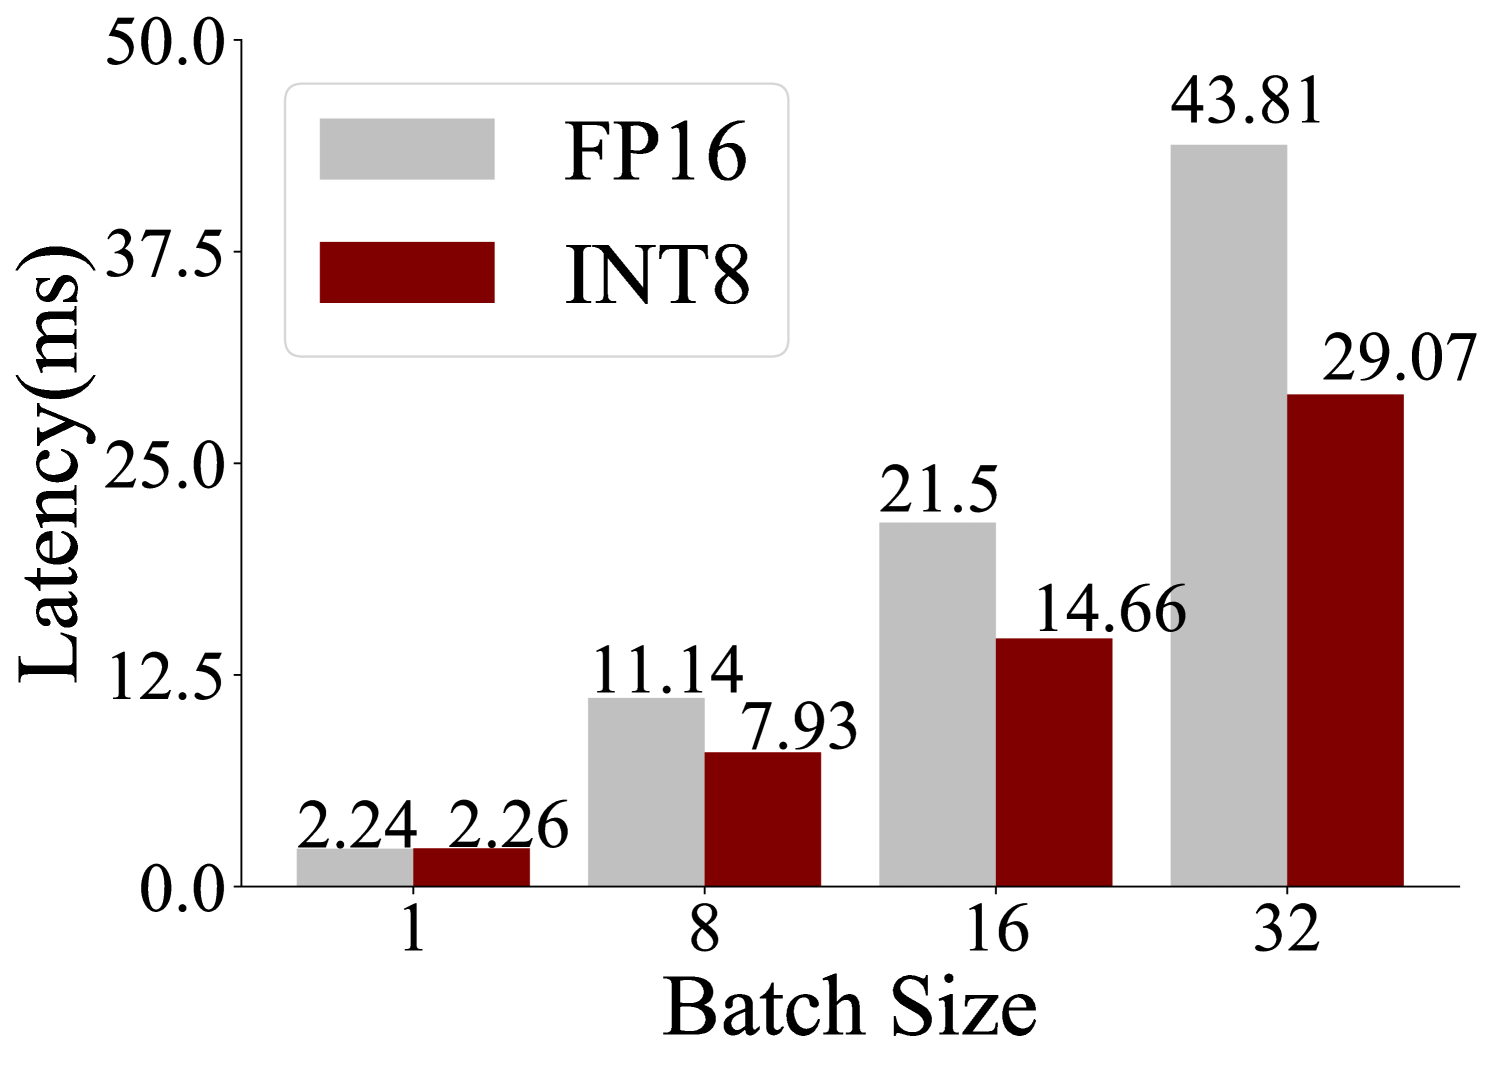
The image is a bar chart comparing the latency (in milliseconds) of FP16 and INT8 data types across different batch sizes (1, 8, 16, and 32). The chart shows that latency generally increases with batch size for both data types, but INT8 consistently exhibits lower latency than FP16 for all batch sizes.
### Components/Axes
* **Title:** Implicit, but the chart compares Latency vs. Batch Size for FP16 and INT8.
* **X-axis:** Batch Size, with values 1, 8, 16, and 32.
* **Y-axis:** Latency (ms), with a scale from 0.0 to 50.0, marked at intervals of 12.5 (0.0, 12.5, 25.0, 37.5, 50.0).
* **Legend:** Located in the top-left corner.
* FP16: Represented by light gray bars.
* INT8: Represented by dark red bars.
### Detailed Analysis
The chart presents latency values for FP16 (light gray) and INT8 (dark red) at batch sizes of 1, 8, 16, and 32.
* **Batch Size 1:**
* FP16: Latency is 2.24 ms.
* INT8: Latency is 2.26 ms.
* **Batch Size 8:**
* FP16: Latency is 11.14 ms.
* INT8: Latency is 7.93 ms.
* **Batch Size 16:**
* FP16: Latency is 21.5 ms.
* INT8: Latency is 14.66 ms.
* **Batch Size 32:**
* FP16: Latency is 43.81 ms.
* INT8: Latency is 29.07 ms.
### Key Observations
* Latency increases as batch size increases for both FP16 and INT8.
* INT8 consistently shows lower latency than FP16 for all batch sizes.
* The difference in latency between FP16 and INT8 becomes more pronounced as the batch size increases.
### Interpretation
The data suggests that using INT8 data type results in lower latency compared to FP16, especially at larger batch sizes. This indicates that INT8 is more efficient for processing larger batches of data, potentially due to reduced memory bandwidth requirements and faster computation. The increasing latency with batch size is expected, as larger batches require more processing time. The significant difference in latency at batch size 32 suggests that INT8 could offer substantial performance benefits in scenarios involving large batch processing.