\n
## Bar Chart: Latency vs. Batch Size for FP16 and INT8 Precision
### Overview
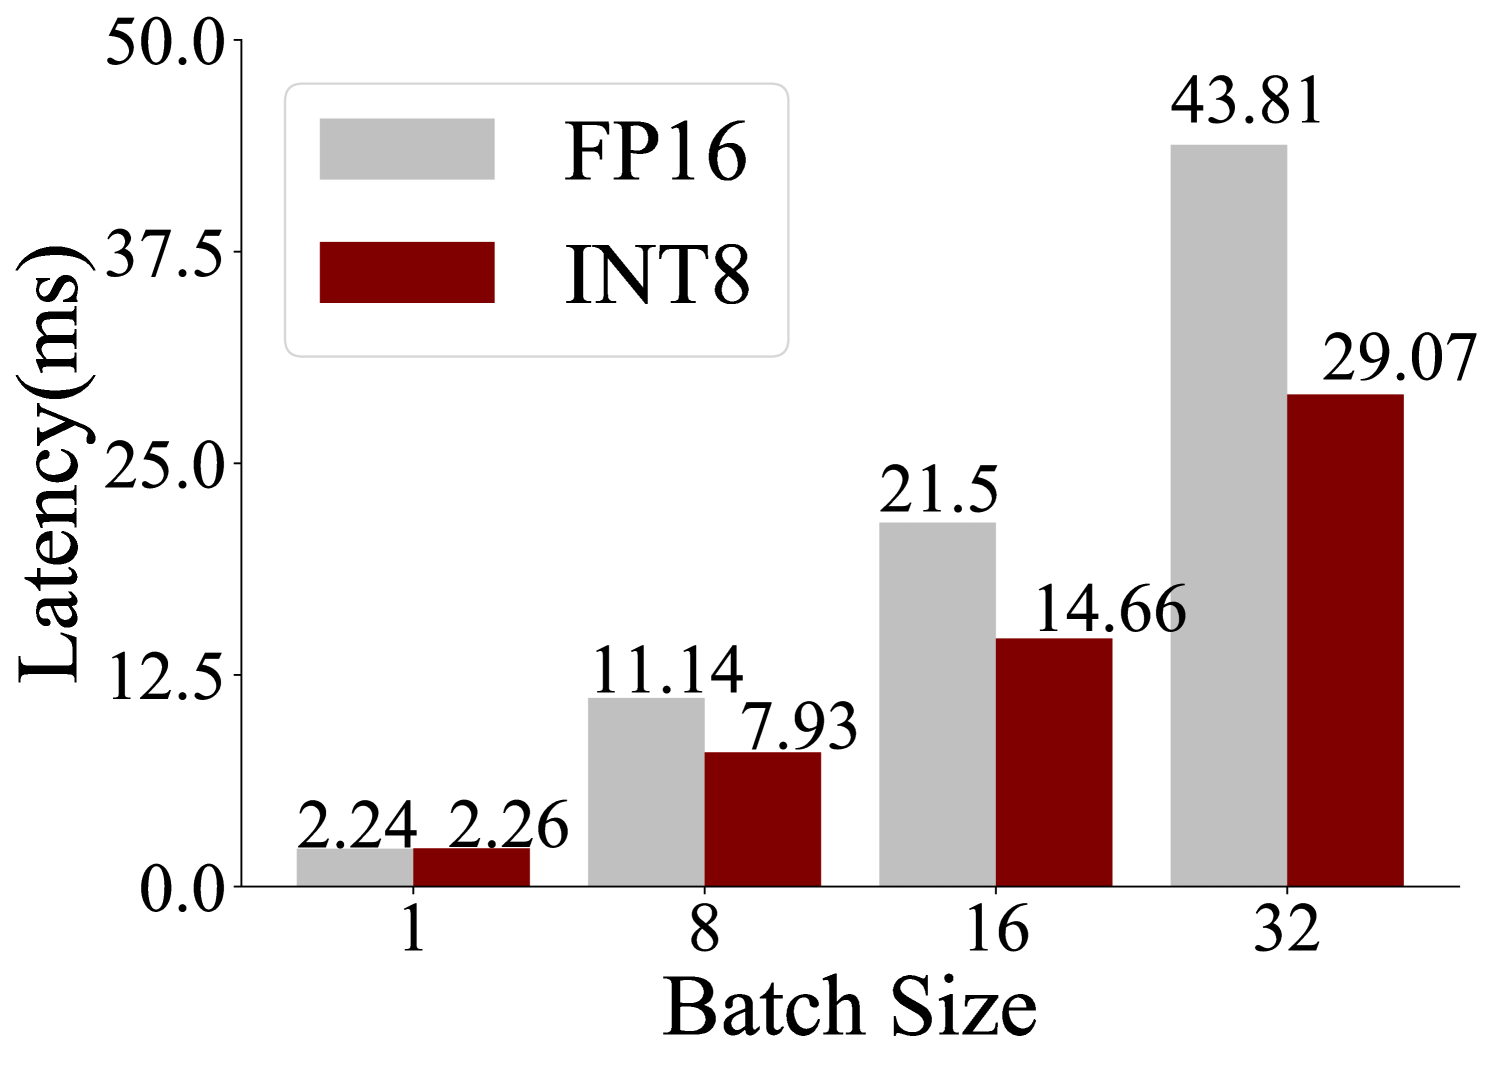
The image is a grouped bar chart comparing the inference latency (in milliseconds) of two numerical precision formats, FP16 (16-bit floating point) and INT8 (8-bit integer), across four different batch sizes. The chart demonstrates how latency scales with increasing batch size for each format and highlights the performance difference between them.
### Components/Axes
* **Chart Type:** Grouped vertical bar chart.
* **X-Axis:** Labeled **"Batch Size"**. It has four discrete categories: **1, 8, 16, and 32**.
* **Y-Axis:** Labeled **"Latency(ms)"**. The scale is linear, ranging from **0.0 to 50.0**, with major tick marks at intervals of 12.5 (0.0, 12.5, 25.0, 37.5, 50.0).
* **Legend:** Located in the **top-left corner** of the chart area.
* A light gray rectangle corresponds to **"FP16"**.
* A dark red (maroon) rectangle corresponds to **"INT8"**.
* **Data Labels:** The exact latency value is printed above each bar.
### Detailed Analysis
The chart presents the following precise data points, confirmed by matching bar color to the legend:
| Batch Size | FP16 Latency (ms) | INT8 Latency (ms) |
| :--- | :--- | :--- |
| **1** | 2.24 | 2.26 |
| **8** | 11.14 | 7.93 |
| **16** | 21.5 | 14.66 |
| **32** | 43.81 | 29.07 |
**Trend Verification:**
* **FP16 Series (Light Gray Bars):** The latency shows a clear, near-linear upward trend as batch size increases. The line formed by the tops of the gray bars slopes steeply upward from left to right.
* **INT8 Series (Dark Red Bars):** The latency also increases with batch size, but the slope is less steep than for FP16. The upward trend is consistent.
### Key Observations
1. **Performance Crossover:** At the smallest batch size of 1, the latencies are virtually identical (2.24 ms vs. 2.26 ms), with INT8 being marginally slower. This is the only point where INT8 does not show an advantage.
2. **Growing Advantage with Batch Size:** For all batch sizes greater than 1, INT8 demonstrates significantly lower latency than FP16. The absolute and relative performance gap widens as the batch size increases.
3. **Scaling Behavior:** Both precision formats exhibit latency that scales roughly linearly with batch size. However, the scaling factor (the slope) is lower for INT8.
4. **Magnitude of Difference:** At the largest measured batch size (32), INT8 latency (29.07 ms) is approximately **33.6% lower** than FP16 latency (43.81 ms).
### Interpretation
This chart provides a clear performance comparison relevant to machine learning inference optimization. The data suggests that:
* **INT8 quantization offers a substantial latency benefit** over FP16 for batched inference workloads. This benefit becomes more pronounced as the batch size increases, making INT8 particularly advantageous for high-throughput scenarios.
* The minimal difference at batch size 1 indicates that the overhead of processing in INT8 format is negligible compared to the computational savings it provides. The primary advantage stems from more efficient computation and memory bandwidth usage with 8-bit integers versus 16-bit floats.
* The consistent linear scaling for both formats implies predictable performance characteristics, which is crucial for system design and capacity planning. The lower slope for INT8 means it can handle larger batches with a smaller relative penalty in latency.
* **Practical Implication:** For applications where maximizing throughput (processed items per second) is critical, using INT8 precision is strongly favored, especially when operating with batch sizes of 8 or more. The choice between FP16 and INT8 at very low batch sizes (like 1) may depend on other factors such as model accuracy requirements, as the latency difference is negligible.