## Bar Chart: Latency Comparison Between FP16 and INT8 Across Batch Sizes
### Overview
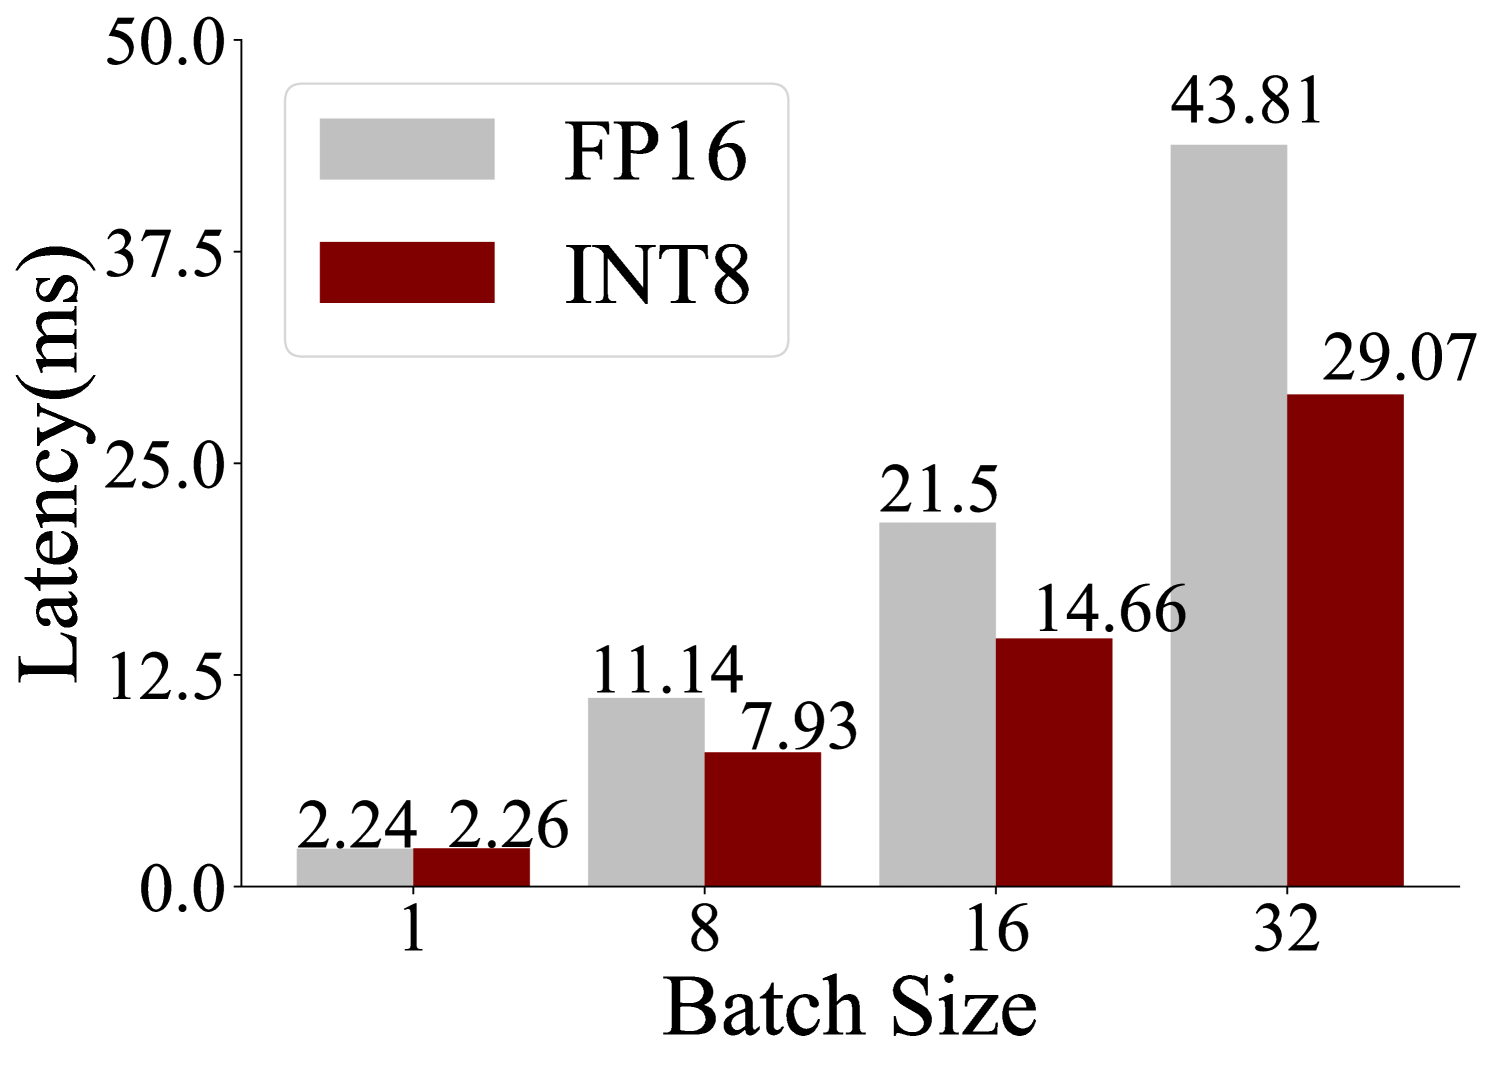
The chart compares latency (in milliseconds) for two computational methods, **FP16** (gray bars) and **INT8** (red bars), across four batch sizes: 1, 8, 16, and 32. Latency increases with batch size for both methods, but FP16 consistently exhibits higher latency than INT8.
### Components/Axes
- **X-axis (Batch Size)**: Labeled "Batch Size" with discrete categories: 1, 8, 16, 32.
- **Y-axis (Latency)**: Labeled "Latency (ms)" with a scale from 0.0 to 50.0.
- **Legend**: Located in the top-left corner, associating gray with FP16 and red with INT8.
- **Bar Groups**: Each batch size has two adjacent bars (FP16 and INT8) with numerical values labeled on top.
### Detailed Analysis
- **Batch Size 1**:
- FP16: 2.24 ms
- INT8: 2.26 ms
- **Batch Size 8**:
- FP16: 11.14 ms
- INT8: 7.93 ms
- **Batch Size 16**:
- FP16: 21.5 ms
- INT8: 14.66 ms
- **Batch Size 32**:
- FP16: 43.81 ms
- INT8: 29.07 ms
### Key Observations
1. **FP16 vs. INT8**: FP16 latency is consistently higher than INT8 across all batch sizes.
2. **Scaling Behavior**: Both methods show linear latency growth with batch size, but FP16 scales more steeply.
3. **Divergence at Larger Batches**: The latency gap widens significantly at batch size 32 (FP16: 43.81 ms vs. INT8: 29.07 ms).
### Interpretation
The data demonstrates that **INT8 is more latency-efficient than FP16**, particularly at larger batch sizes. This suggests INT8’s use of lower-precision arithmetic reduces computational overhead, making it preferable for high-throughput applications. However, FP16’s higher precision may be necessary for tasks requiring numerical accuracy, despite its performance cost. The widening gap at batch size 32 highlights a critical trade-off between precision and efficiency in system design.