## Diagram: Graph Configurations
### Overview
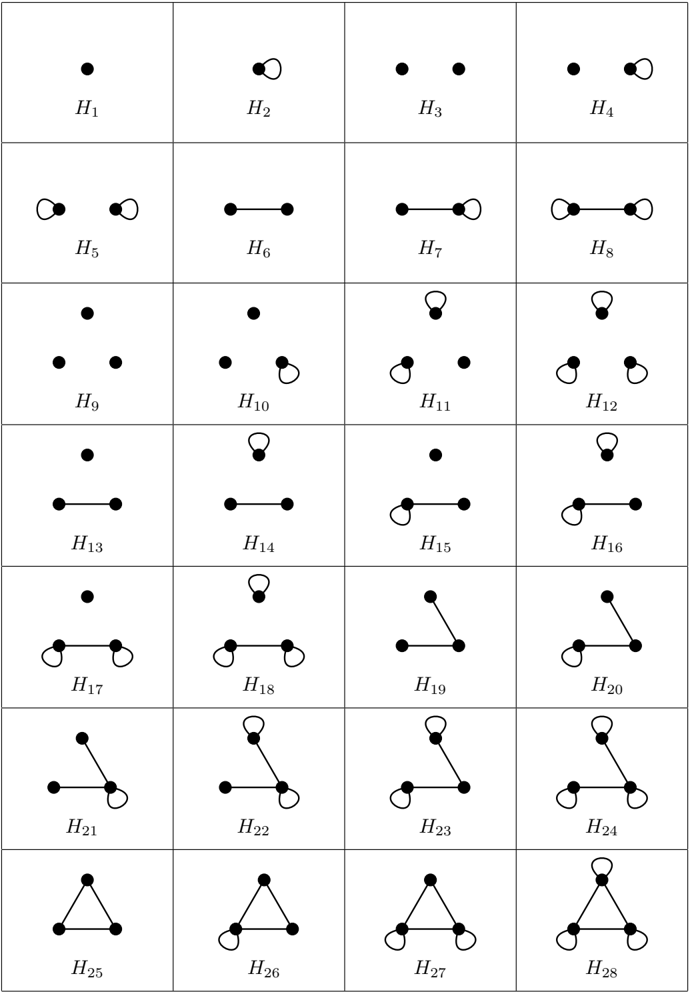
The image presents a grid of 28 diagrams, each depicting a graph configuration. Each graph consists of nodes (represented by filled circles) and edges (represented by lines). Some nodes have self-loops. Each diagram is labeled with "H" followed by a number from 1 to 28.
### Components/Axes
* **Nodes:** Represented by filled black circles.
* **Edges:** Represented by black lines connecting nodes.
* **Self-Loops:** Represented by curved lines originating and terminating at the same node.
* **Labels:** Each diagram is labeled with "H" followed by a number (H1 to H28). The labels are located below each diagram.
* **Grid:** The diagrams are arranged in a 4x7 grid.
### Detailed Analysis or ### Content Details
Here's a breakdown of each graph configuration:
* **H1:** A single node.
* **H2:** A single node with a self-loop.
* **H3:** Two isolated nodes.
* **H4:** Two isolated nodes, one with a self-loop.
* **H5:** Two isolated nodes, each with a self-loop.
* **H6:** Two nodes connected by an edge.
* **H7:** Two nodes connected by an edge, with one node having a self-loop.
* **H8:** Two nodes connected by an edge, with each node having a self-loop.
* **H9:** Three isolated nodes.
* **H10:** Three isolated nodes, one with a self-loop.
* **H11:** Three isolated nodes, two with self-loops.
* **H12:** Three isolated nodes, each with a self-loop.
* **H13:** Two nodes connected by an edge, with one additional isolated node.
* **H14:** Two nodes connected by an edge, with one additional isolated node with a self-loop.
* **H15:** Two nodes connected by an edge, with one additional isolated node with a self-loop.
* **H16:** Two nodes connected by an edge, with one additional isolated node with a self-loop.
* **H17:** Two nodes connected by an edge, with one node having a self-loop. One additional isolated node.
* **H18:** Two nodes connected by an edge, with each node having a self-loop. One additional isolated node.
* **H19:** Three nodes connected in a "V" shape (a path of length 2).
* **H20:** Three nodes connected in a "V" shape, with one node having a self-loop.
* **H21:** Three nodes connected in a "V" shape, with one node having a self-loop.
* **H22:** Three nodes connected in a "V" shape, with one node having a self-loop.
* **H23:** Three nodes connected in a "V" shape, with one node having a self-loop.
* **H24:** Three nodes connected in a "V" shape, with one node having a self-loop.
* **H25:** Three nodes connected in a triangle.
* **H26:** Three nodes connected in a triangle, with one node having a self-loop.
* **H27:** Three nodes connected in a triangle, with one node having a self-loop.
* **H28:** Three nodes connected in a triangle, with one node having a self-loop.
### Key Observations
* The diagrams systematically explore different configurations of nodes, edges, and self-loops.
* The number of nodes ranges from 1 to 3.
* The presence and placement of self-loops vary across the diagrams.
* The connectivity of the nodes varies from isolated nodes to connected edges and triangles.
### Interpretation
The image likely represents a classification or enumeration of different graph structures. The systematic arrangement suggests an attempt to categorize graphs based on their fundamental properties, such as the number of nodes, the presence of edges, and the existence of self-loops. The diagrams could be used in graph theory to illustrate basic graph types or as building blocks for more complex graph structures.