## Diagram Grid: Graph Configurations (H1-H28)
### Overview
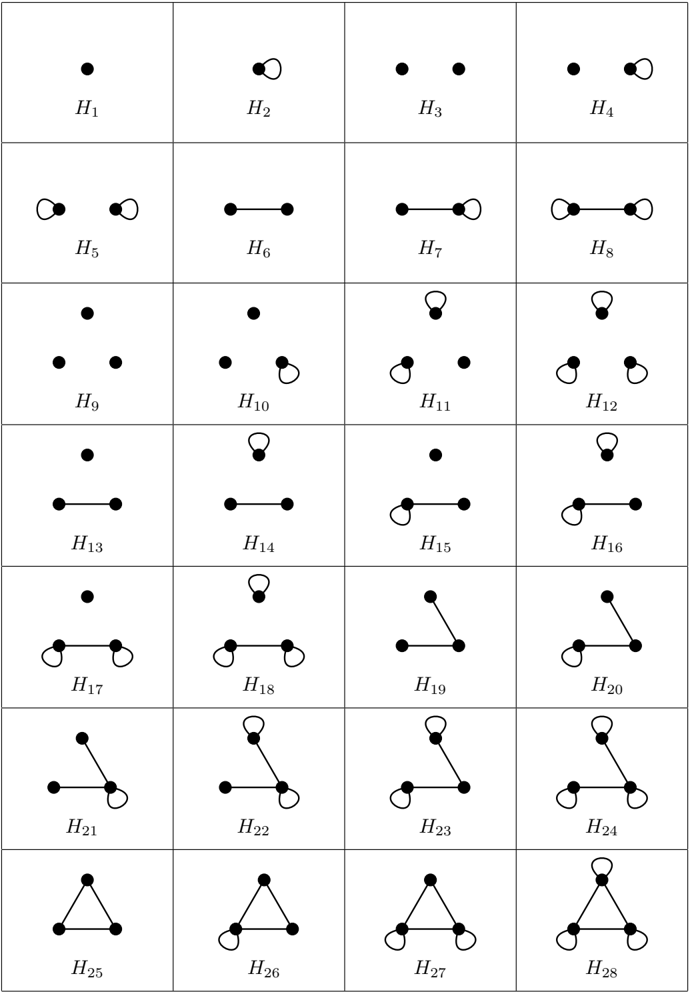
The image displays a 4x7 grid (28 total) of abstract diagrams labeled H1 to H28. Each diagram consists of nodes (black dots) and edges (lines), with some nodes encircled. The grid progresses from simple to complex configurations, suggesting a systematic classification of graph structures.
### Components/Axes
- **Nodes**: Represented as black dots. Some nodes have circles around them, potentially indicating a subset or special property.
- **Edges**: Lines connecting nodes, varying in direction and presence.
- **Labels**: Each diagram is labeled H1 to H28 in black text at the bottom of its cell.
- **Grid Structure**: 4 rows (top to bottom) and 7 columns (left to right). No explicit axes or legends are present.
### Detailed Analysis
1. **H1-H4 (Row 1)**:
- H1: Single isolated node.
- H2: Node with a self-loop (circle).
- H3: Two nodes connected by an edge.
- H4: Two nodes with one node having a self-loop.
2. **H5-H8 (Row 2)**:
- H5/H6: Two nodes with loops (H5: loops on both nodes; H6: loop on one node).
- H7/H8: Two nodes connected by an edge, with one node having a loop.
3. **H9-H12 (Row 3)**:
- H9/H10: Three nodes with varying edge connections (H9: linear; H10: branched).
- H11/H12: Three nodes with loops on one or more nodes.
4. **H13-H16 (Row 4)**:
- H13/H14: Two nodes with loops (H13: loop on one node; H14: loop on both).
- H15/H16: Two nodes connected by an edge, with loops on one or both nodes.
5. **H17-H20 (Row 5)**:
- H17/H18: Three nodes with loops (H17: loops on two nodes; H18: loop on one node).
- H19/H20: Three nodes with edges forming a "V" shape, with loops on one or more nodes.
6. **H21-H24 (Row 6)**:
- H21/H22: Three nodes with loops (H21: loop on one node; H22: loop on two nodes).
- H23/H24: Three nodes with edges forming a triangle, with loops on one or more nodes.
7. **H25-H28 (Row 7)**:
- H25/H26: Three nodes forming a triangle (H25: no loops; H26: loop on one node).
- H27/H28: Three nodes forming a triangle with loops on all nodes (H27: loops on two nodes; H28: loops on all three).
### Key Observations
- **Progression**: Diagrams evolve from isolated nodes (H1) to complex interconnected structures (H28), suggesting a taxonomy of graph complexity.
- **Loops**: Circles around nodes appear consistently in later diagrams (H2-H28), possibly denoting self-referential properties or cycles.
- **Symmetry**: Some diagrams (e.g., H3, H6, H9) exhibit bilateral symmetry, while others (e.g., H10, H19) are asymmetric.
- **Missing Data**: No numerical values, legends, or axis titles are present, limiting quantitative analysis.
### Interpretation
The diagrams likely represent **graph theory concepts**, such as:
- **Self-loops**: Circles may indicate nodes with self-referential edges (e.g., H2, H4).
- **Connectivity**: Progression from isolated nodes (H1) to fully connected graphs (H28) could illustrate increasing complexity in network structures.
- **Categorization**: The grid may classify graphs by edge density, loop presence, or node connectivity patterns.
Notable anomalies include the abrupt introduction of loops in H2 and the absence of a clear legend to define the meaning of circles. The lack of numerical data prevents statistical analysis, but the visual progression suggests a pedagogical or conceptual framework for understanding graph evolution.