## Chart Type: Line Graphs Comparing ACC and ECE
### Overview
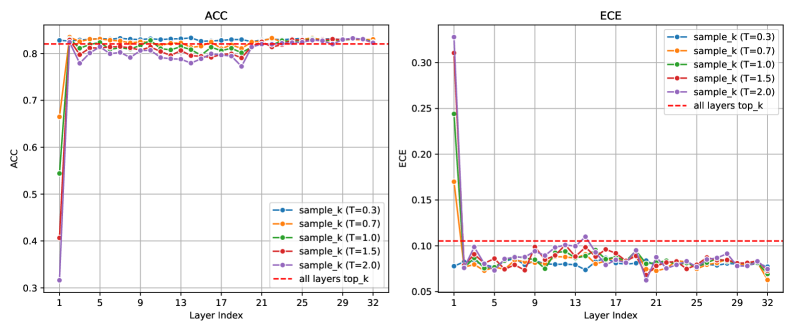
The image contains two line graphs side-by-side. The left graph displays the Accuracy (ACC) versus Layer Index, while the right graph shows Expected Calibration Error (ECE) versus Layer Index. Both graphs compare different sampling strategies (sample_k) with varying temperature parameters (T=0.3, 0.7, 1.0, 1.5, 2.0) and a baseline "all layers top_k".
### Components/Axes
**Left Graph (ACC):**
* **Title:** ACC
* **Y-axis:** ACC, ranging from 0.3 to 0.8.
* **X-axis:** Layer Index, ranging from 1 to 32.
* **Legend (Top-Right):**
* Blue: sample_k (T=0.3)
* Orange: sample_k (T=0.7)
* Green: sample_k (T=1.0)
* Red: sample_k (T=1.5)
* Purple: sample_k (T=2.0)
* Dashed Red: all layers top_k
**Right Graph (ECE):**
* **Title:** ECE
* **Y-axis:** ECE, ranging from 0.05 to 0.30.
* **X-axis:** Layer Index, ranging from 1 to 32.
* **Legend (Top-Right, same as left graph):**
* Blue: sample_k (T=0.3)
* Orange: sample_k (T=0.7)
* Green: sample_k (T=1.0)
* Red: sample_k (T=1.5)
* Purple: sample_k (T=2.0)
* Dashed Red: all layers top_k
### Detailed Analysis
**Left Graph (ACC):**
* **all layers top_k (Dashed Red):** A horizontal line at approximately ACC = 0.83.
* **sample_k (T=0.3) (Blue):** Starts at approximately ACC = 0.3, rises sharply to approximately 0.83 by Layer Index 2, and then remains relatively stable around 0.83 with minor fluctuations.
* **sample_k (T=0.7) (Orange):** Starts at approximately ACC = 0.4, rises sharply to approximately 0.82 by Layer Index 2, and then remains relatively stable around 0.82 with minor fluctuations.
* **sample_k (T=1.0) (Green):** Starts at approximately ACC = 0.55, rises sharply to approximately 0.81 by Layer Index 2, and then remains relatively stable around 0.81 with minor fluctuations.
* **sample_k (T=1.5) (Red):** Starts at approximately ACC = 0.65, rises sharply to approximately 0.80 by Layer Index 2, and then remains relatively stable around 0.80 with minor fluctuations.
* **sample_k (T=2.0) (Purple):** Starts at approximately ACC = 0.3, rises sharply to approximately 0.82 by Layer Index 2, and then remains relatively stable around 0.82 with minor fluctuations.
**Right Graph (ECE):**
* **all layers top_k (Dashed Red):** A horizontal line at approximately ECE = 0.105.
* **sample_k (T=0.3) (Blue):** Starts at approximately ECE = 0.25, drops sharply to approximately 0.08 by Layer Index 2, and then remains relatively stable around 0.08 with minor fluctuations.
* **sample_k (T=0.7) (Orange):** Starts at approximately ECE = 0.17, drops sharply to approximately 0.08 by Layer Index 2, and then remains relatively stable around 0.08 with minor fluctuations.
* **sample_k (T=1.0) (Green):** Starts at approximately ECE = 0.16, drops sharply to approximately 0.08 by Layer Index 2, and then remains relatively stable around 0.08 with minor fluctuations.
* **sample_k (T=1.5) (Red):** Starts at approximately ECE = 0.10, drops sharply to approximately 0.08 by Layer Index 2, and then remains relatively stable around 0.08 with minor fluctuations.
* **sample_k (T=2.0) (Purple):** Starts at approximately ECE = 0.32, drops sharply to approximately 0.08 by Layer Index 2, and then remains relatively stable around 0.08 with minor fluctuations.
### Key Observations
* In the ACC graph, all sample_k strategies show a rapid increase in accuracy within the first few layers, followed by a plateau.
* The "all layers top_k" baseline achieves a slightly higher and more stable accuracy compared to the sample_k strategies.
* In the ECE graph, all sample_k strategies exhibit a sharp decrease in error within the first few layers, followed by a relatively stable, low error rate.
* The "all layers top_k" baseline has a higher ECE compared to the sample_k strategies after the initial layers.
* The sample_k strategies have very similar ECE values after the initial drop.
### Interpretation
The graphs suggest that using a sampling strategy (sample_k) significantly improves calibration error (ECE) compared to using all layers (all layers top_k), especially after the initial layers. While the "all layers top_k" approach yields slightly higher accuracy (ACC), the sample_k strategies provide a better trade-off between accuracy and calibration, as they achieve comparable accuracy with significantly lower ECE. The temperature parameter (T) in the sample_k strategy doesn't seem to have a significant impact on the final ECE or ACC after the initial layers. The initial layers are critical for both accuracy and calibration, as evidenced by the sharp changes in both metrics within the first few layers.