## Pie Chart: Distribution of Data Types in Pre-training Dataset
### Overview
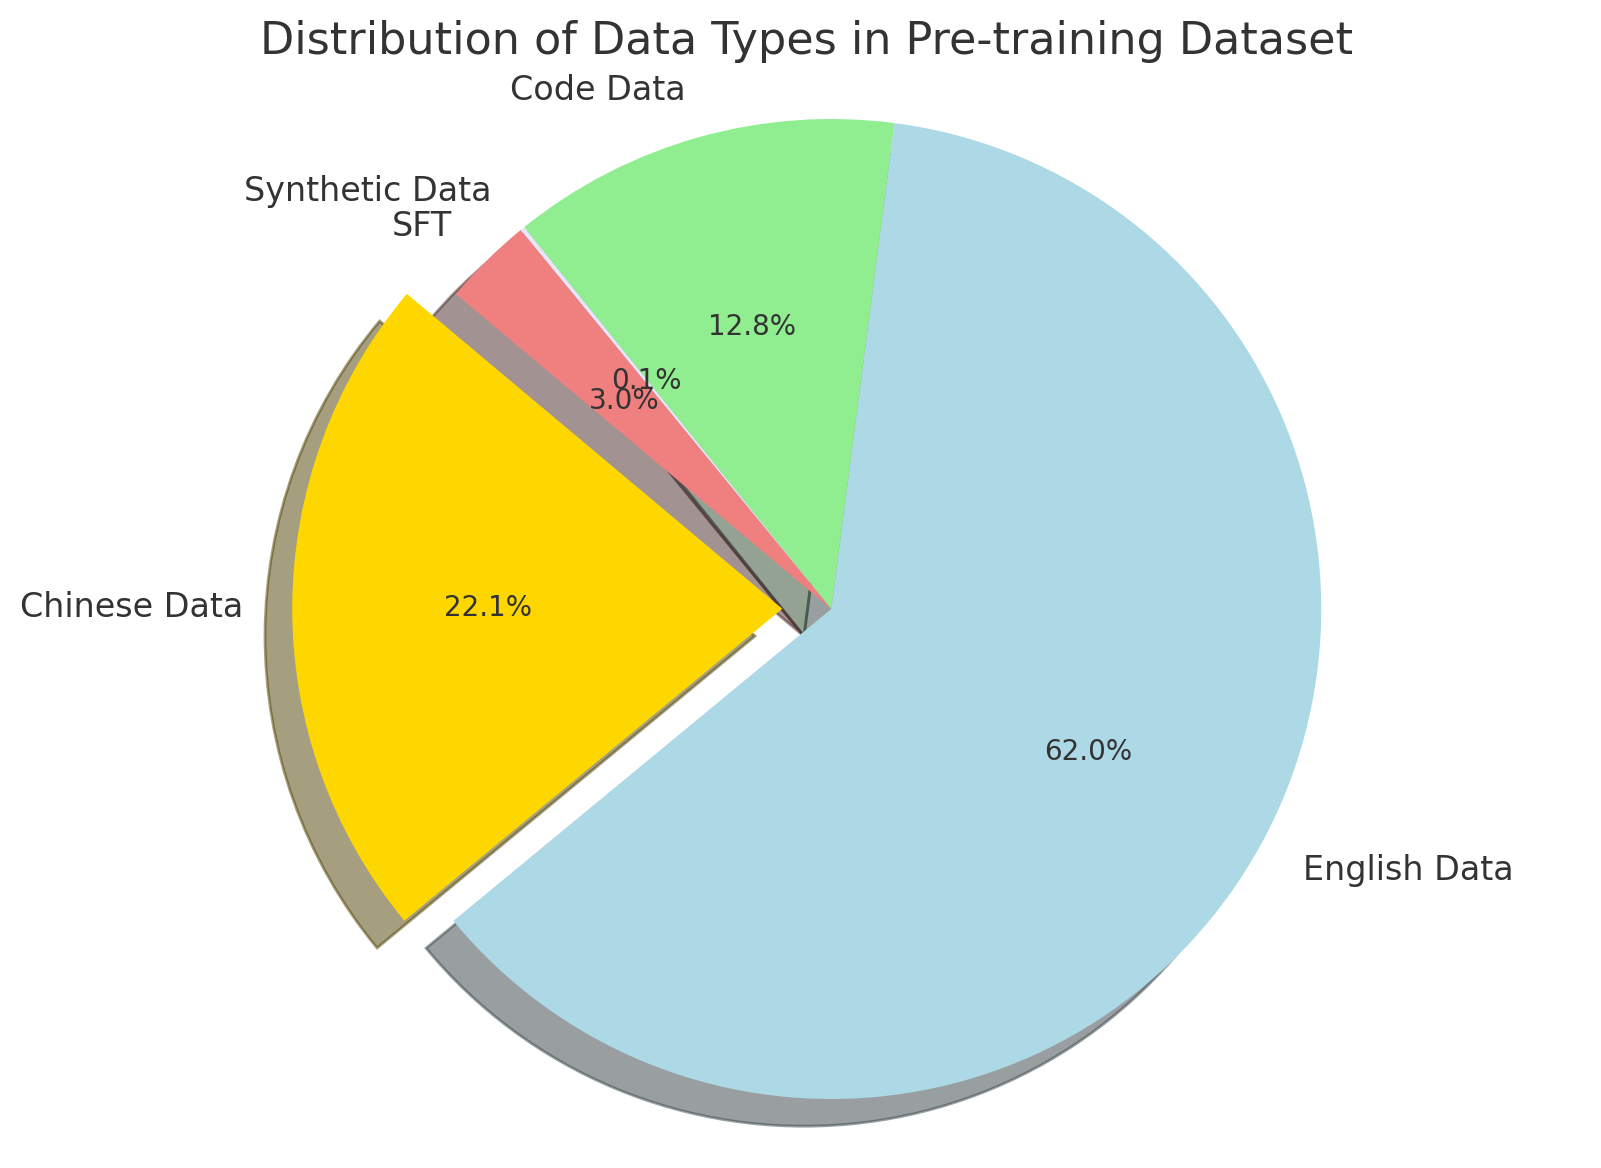
This image is a 3D pie chart illustrating the proportional breakdown of different data types used in a specific "Pre-training Dataset," likely for a Large Language Model (LLM) or similar artificial intelligence system. The chart uses direct labeling with percentages rather than a separate legend, and features one "exploded" slice to draw visual attention. All text in the image is in English.
### Components Isolation & Spatial Grounding
To ensure accurate extraction, the image is divided into the following logical components:
1. **Header Region (Top Center):** Contains the main title of the chart.
2. **Main Chart Region (Center):** A 3D pie chart divided into five distinct slices of varying colors and sizes.
3. **Labeling System (Radial):** Text labels and corresponding percentages are placed adjacent to or directly inside their respective slices.
### Content Details
**Header Text:**
* "Distribution of Data Types in Pre-training Dataset"
**Data Series (Clockwise, starting from the largest slice):**
* **Visual Trend:** The largest slice dominates the right and bottom half of the chart.
* **Label:** English Data
* **Color:** Light Blue
* **Position:** Right and bottom hemisphere.
* **Value:** 62.0%
* **Visual Trend:** The second-largest slice is visually emphasized by being "exploded" (pulled away from the center axis) with a pronounced 3D shadow.
* **Label:** Chinese Data
* **Color:** Gold / Yellow
* **Position:** Left side, exploded outward.
* **Value:** 22.1%
* **Visual Trend:** A very thin sliver located between the yellow and pink slices.
* **Label:** SFT (Supervised Fine-Tuning)
* **Color:** Grey
* **Position:** Middle-left, wedged between Chinese Data and Synthetic Data.
* **Value:** 0.1%
* **Visual Trend:** A small slice located in the upper-left quadrant.
* **Label:** Synthetic Data
* **Color:** Light Red / Pink
* **Position:** Top-left.
* **Value:** 3.0%
* **Visual Trend:** A moderately sized slice occupying the top portion of the chart.
* **Label:** Code Data
* **Color:** Light Green
* **Position:** Top center.
* **Value:** 12.8%
*(Data Verification Check: 62.0 + 22.1 + 0.1 + 3.0 + 12.8 = 100.0%)*
### Key Observations
* **Dominance of English:** English data constitutes the clear majority of the dataset at nearly two-thirds (62.0%).
* **Bilingual Focus:** Together, English and Chinese data make up 84.1% of the total pre-training corpus.
* **Visual Emphasis:** The "Chinese Data" slice is the only piece of the pie that is exploded. In data visualization, this technique is specifically used to draw the viewer's eye to a specific data point, regardless of whether it is the largest value.
* **Inclusion of Code:** Code data represents a significant minority share at 12.8%, which is larger than the synthetic and SFT data combined.
* **Minimal SFT:** SFT data is present but makes up a statistically tiny fraction (0.1%) of this specific dataset.
### Interpretation
This chart provides deep insight into the design philosophy and intended capabilities of the AI model being trained:
1. **Target Demographics and Origin:** The massive concentration of English and Chinese data strongly suggests this is a bilingual foundation model. Furthermore, the deliberate visual explosion of the "Chinese Data" slice implies that the model's proficiency in Chinese is a primary selling point, a novel contribution, or the specific focus of the presentation/paper this chart belongs to. It is highly probable this model originates from a Chinese AI laboratory or is targeting the Chinese tech market.
2. **Reasoning Capabilities:** The inclusion of 12.8% "Code Data" is a standard modern practice in LLM pre-training. Even if a model is not strictly meant to be a coding assistant, training on code has been proven to significantly enhance a model's general logic, structural reasoning, and problem-solving abilities.
3. **Data Scarcity and Quality:** The presence of "Synthetic Data" (3.0%) indicates that the developers are using AI-generated data to augment their human-generated corpus. This is often done to fill gaps in specific domains (like math or logic) where high-quality human data is scarce.
4. **Training Methodology Anomaly:** The inclusion of "SFT" (Supervised Fine-Tuning) data at the *pre-training* stage is notable. Traditionally, pre-training uses raw, unstructured data, while SFT is a secondary phase using highly curated prompt-response pairs. Including 0.1% SFT data in the pre-training mix suggests a hybrid training approach—often referred to as "instruction-tuned pre-training"—designed to make the base model more aligned and conversational right out of the gate, before formal fine-tuning even begins.