\n
## Pie Chart: Distribution of Data Types in Pre-training Dataset
### Overview
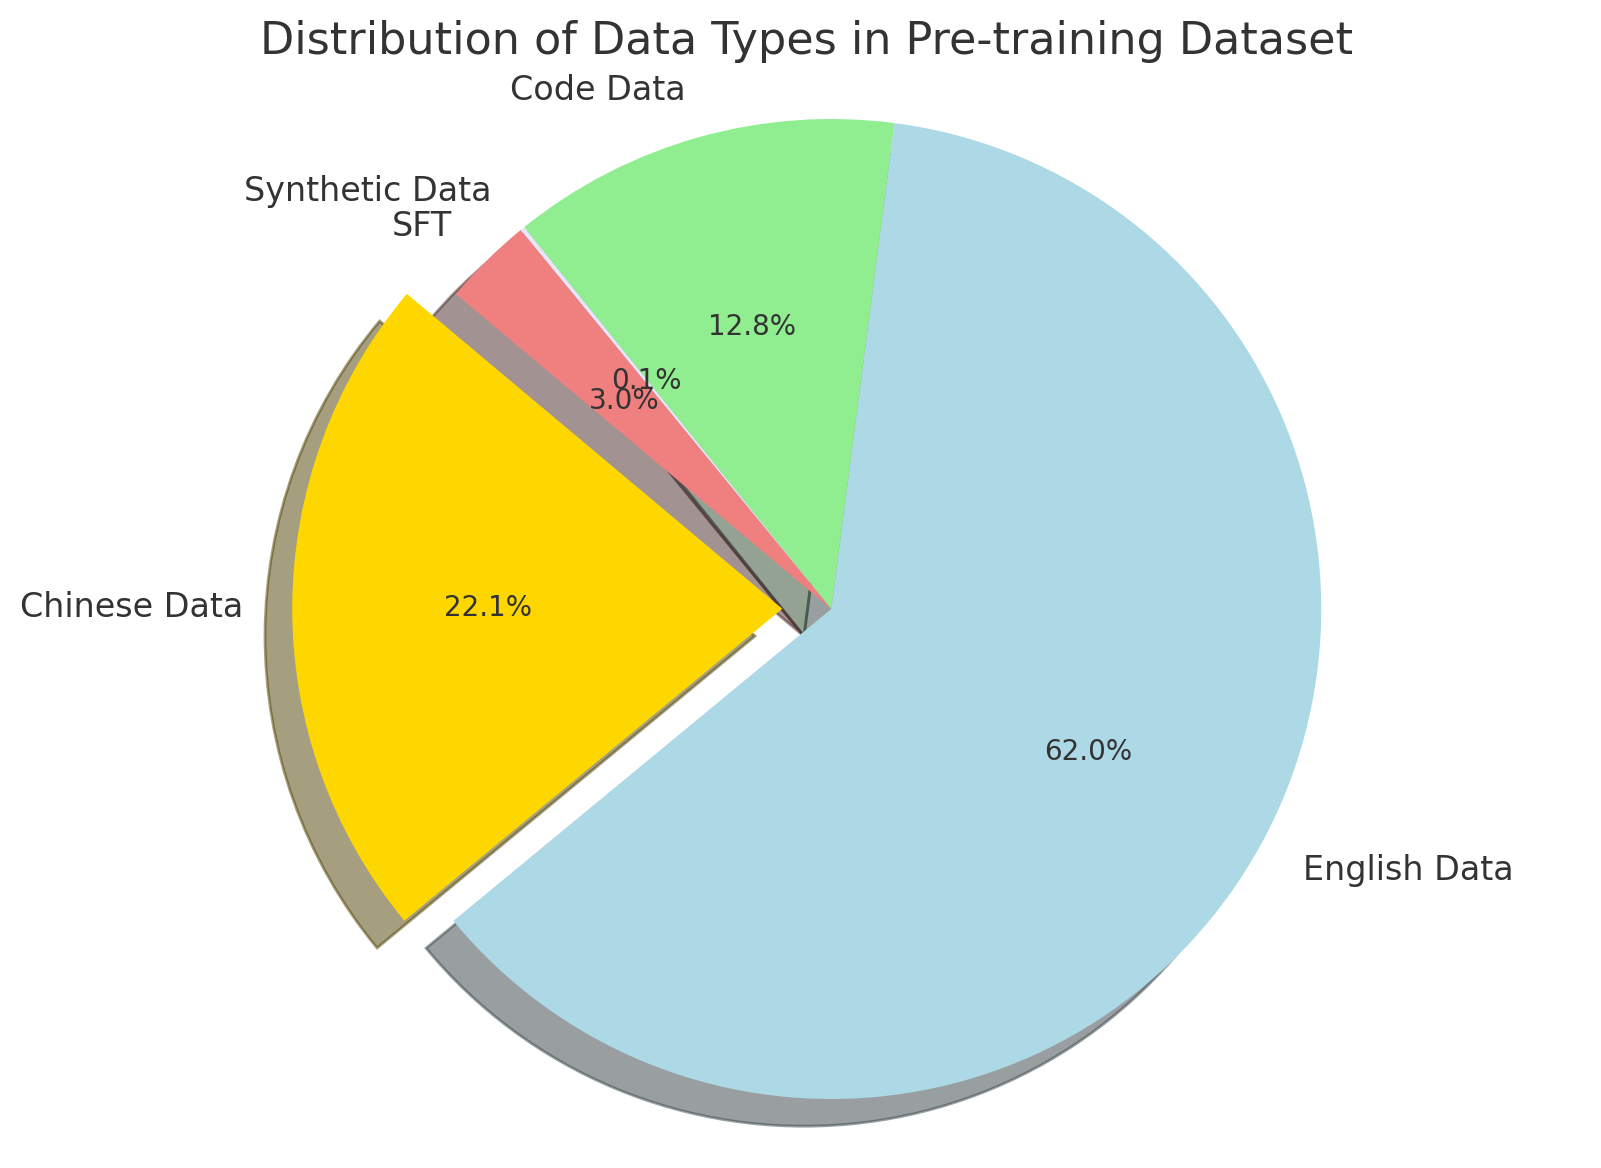
This image presents a pie chart illustrating the distribution of different data types within a pre-training dataset. The chart shows the percentage contribution of English Data, Chinese Data, Synthetic Data (SFT), and Code Data.
### Components/Axes
* **Title:** "Distribution of Data Types in Pre-training Dataset" (Top-center)
* **Data Categories:** English Data, Chinese Data, Synthetic Data SFT, Code Data.
* **Percentages:** Values are displayed directly on each slice of the pie chart.
* **Legend:** The legend is positioned in the top-left corner, associating colors with data types.
### Detailed Analysis
The pie chart is divided into four segments, each representing a different data type and its corresponding percentage.
* **English Data:** Represented by a light blue color, occupies the largest portion of the pie chart, accounting for approximately 62.0%.
* **Chinese Data:** Represented by a yellow color, constitutes approximately 22.1% of the dataset.
* **Synthetic Data SFT:** Represented by a red color, makes up a small portion, approximately 3.8%.
* **Code Data:** Represented by a light green color, accounts for approximately 12.8% of the dataset.
### Key Observations
* English Data dominates the pre-training dataset, comprising the majority (62.0%) of the data.
* Chinese Data is the second most significant contributor, representing about 22.1%.
* Synthetic Data (SFT) represents the smallest portion of the dataset, at only 3.8%.
* Code Data accounts for a moderate portion, approximately 12.8%.
### Interpretation
The data suggests a strong emphasis on English language data in the pre-training process. The inclusion of Chinese data indicates a potential effort to support multilingual capabilities. The relatively small proportion of Synthetic Data (SFT) suggests it may be used for specific tasks or as a supplementary data source. The presence of Code Data indicates the model is likely being trained to understand and generate code. The distribution highlights the primary language focus of the pre-training dataset, with English being the dominant language. The balance between different data types could influence the model's performance on various tasks and its ability to generalize across different languages and domains.