## Pie Chart: Distribution of Data Types in Pre-training Dataset
### Overview
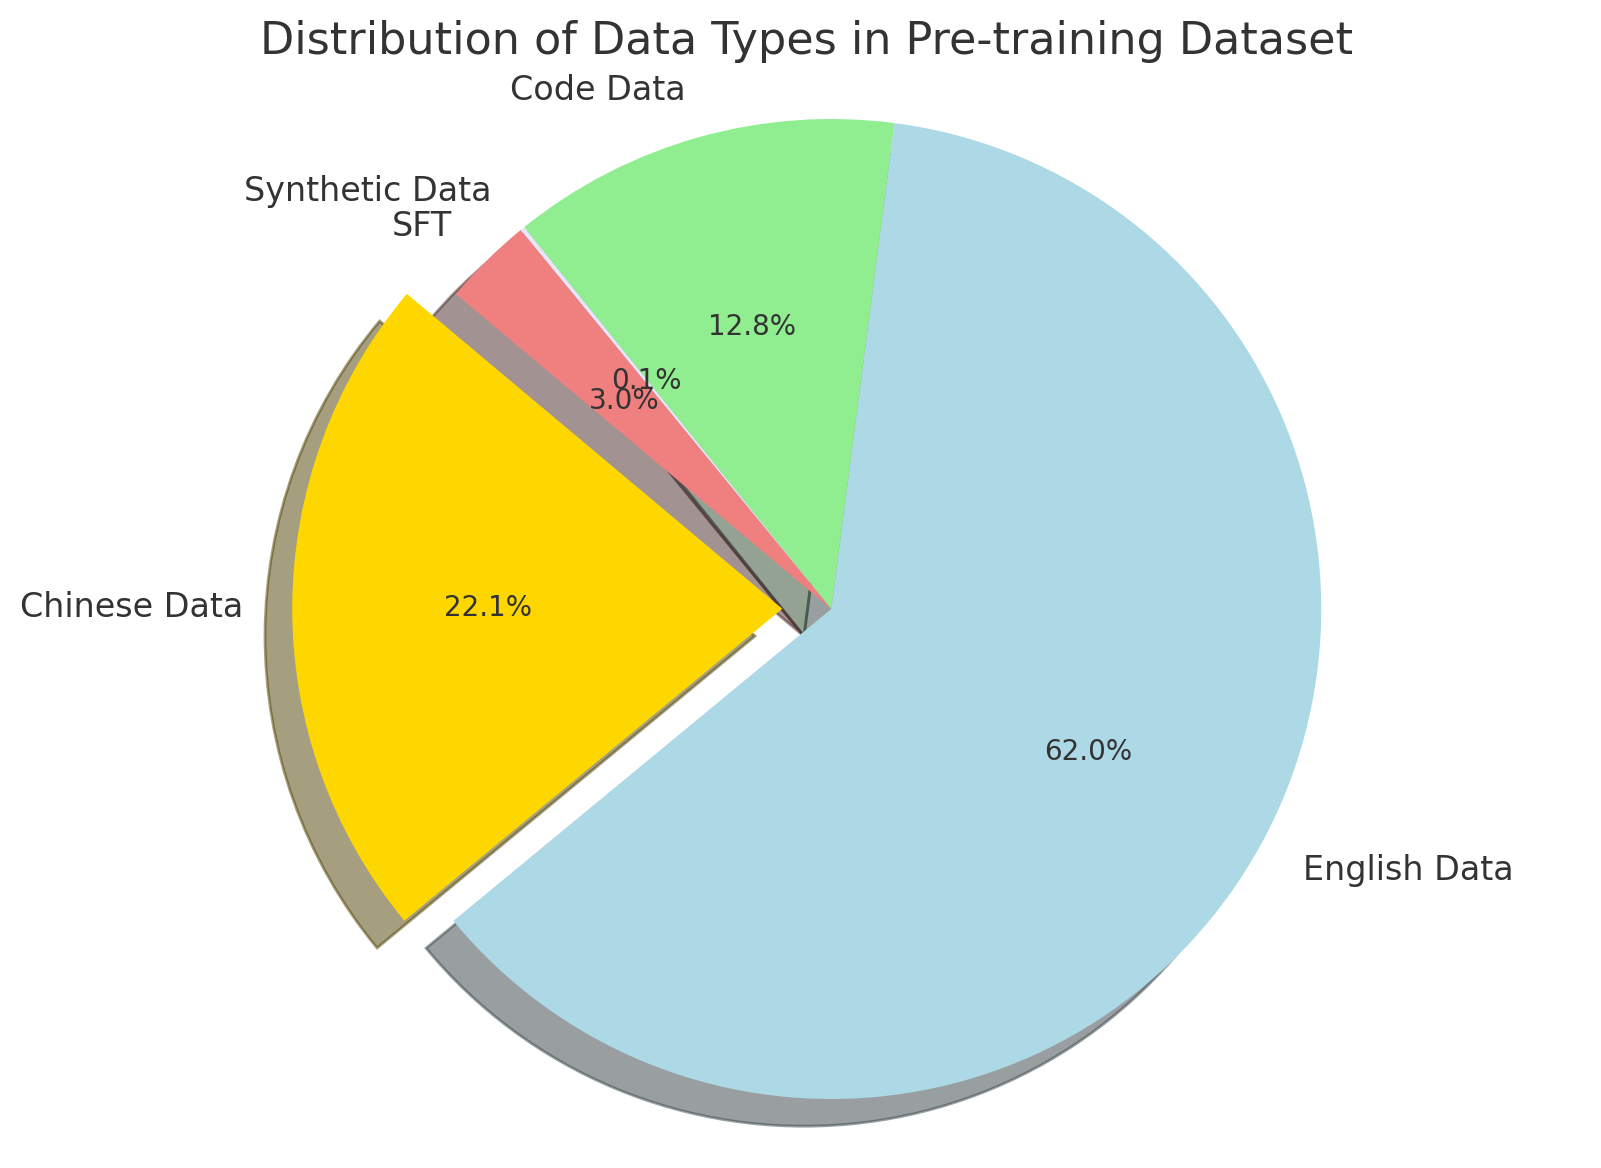
The chart illustrates the proportional distribution of four data types in a pre-training dataset. English Data dominates the dataset, followed by Chinese Data, Code Data, and Synthetic Data SFT. Percentages are explicitly labeled on each segment, with a legend confirming color-to-label mappings.
### Components/Axes
- **Title**: "Distribution of Data Types in Pre-training Dataset" (top-center).
- **Legend**: Located at the bottom-right, mapping colors to data types:
- Light blue: English Data
- Yellow: Chinese Data
- Green: Code Data
- Red: Synthetic Data SFT
- **Segments**: Four wedge-shaped sections arranged clockwise, starting from the largest (English Data) at the top-right.
### Detailed Analysis
1. **English Data**:
- **Percentage**: 62.0% (largest segment).
- **Color**: Light blue.
- **Position**: Occupies the majority of the chart, starting from the top-right and extending clockwise.
2. **Chinese Data**:
- **Percentage**: 22.1%.
- **Color**: Yellow.
- **Position**: Adjacent to English Data, occupying the lower-left quadrant.
3. **Code Data**:
- **Percentage**: 12.8%.
- **Color**: Green.
- **Position**: Smaller segment between Chinese Data and Synthetic Data SFT.
4. **Synthetic Data SFT**:
- **Percentage**: 3.0% (smallest segment).
- **Color**: Red.
- **Position**: Tiny wedge between Code Data and English Data.
### Key Observations
- English Data constitutes over half the dataset, indicating a strong bias toward English-language content.
- Chinese Data is the second-largest contributor, suggesting significant multilingual focus.
- Code Data and Synthetic Data SFT are minor components, with Synthetic Data SFT being the least represented (3.0%).
### Interpretation
The dataset is heavily skewed toward English-language data, which may reflect the source material (e.g., web scraping from English-dominant platforms) or prioritization of English in pre-training. The inclusion of Chinese Data (22.1%) highlights efforts to support multilingual capabilities, while Code Data (12.8%) suggests specialized training for programming tasks. The minimal presence of Synthetic Data SFT (3.0%) raises questions about the reliance on synthetic methods versus real-world data. This distribution could impact model performance on non-English tasks or code-related applications, potentially requiring augmentation for balanced results.