\n
## Diagram: Co-Association Schematic
### Overview
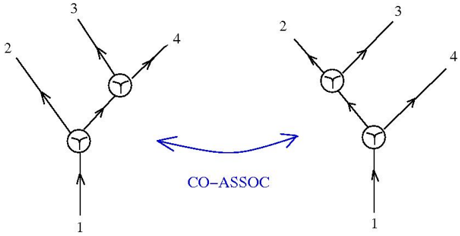
The image presents a schematic diagram illustrating a co-association relationship between two identical branching structures. Each structure consists of two branching points, with input and output lines labeled 1 through 4. A blue, bidirectional arrow labeled "CO-ASSOC" connects the two structures, indicating a co-association link.
### Components/Axes
The diagram consists of:
* Two identical branching structures.
* Four labeled input/output lines per structure (1, 2, 3, 4).
* Branching points represented by circular nodes with three lines converging/diverging.
* A bidirectional arrow labeled "CO-ASSOC" connecting the two structures.
### Detailed Analysis or Content Details
The diagram depicts two identical structures. Each structure has a single input line labeled "1" at the bottom, which splits into two output lines. These output lines then converge at a second branching point, resulting in two further output lines labeled "3" and "4". The input line "2" enters the first branching point directly.
The "CO-ASSOC" arrow is positioned horizontally between the two structures, approximately in the center. The arrow is blue and has a double-headed design, indicating a bidirectional relationship.
The lines are all black and of similar thickness. The labels (1, 2, 3, 4, and CO-ASSOC) are also black.
### Key Observations
* The diagram emphasizes symmetry between the two structures.
* The "CO-ASSOC" label suggests a correlation or association between the two branching processes.
* The diagram does not provide any quantitative data or specific values; it is a purely schematic representation.
### Interpretation
The diagram likely represents a simplified model of a biological or computational process where two similar pathways or systems are interconnected and influence each other. The "CO-ASSOC" label suggests that the activity or state of one system is correlated with the activity or state of the other. The branching points could represent decision points or regulatory elements within the systems.
The lack of quantitative data suggests that the diagram is intended to convey a conceptual relationship rather than precise measurements. The symmetry of the structures implies that the relationship is reciprocal or balanced. The diagram could be used to illustrate concepts in systems biology, network theory, or signal processing. It is a visual representation of a relationship, not a data-driven chart.