## Heatmap: Distribution of Average Iterations
### Overview
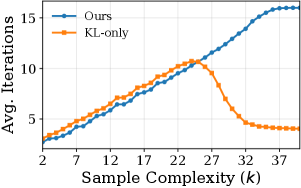
The heatmap shows the distribution of average iterations required for two different methods, "Ours" and "KL-only," as the sample complexity increases. The x-axis represents the sample complexity, and the y-axis represents the average iterations.
### Components/Axes
- **x-axis**: Sample Complexity (k)
- **y-axis**: Average Iterations
- **Legend**:
- "Ours" (blue)
- "KL-only" (orange)
### Detailed Analysis or Content Details
The heatmap illustrates that both methods require an increasing number of iterations as the sample complexity increases. The "Ours" method (blue) generally requires fewer iterations compared to the "KL-only" method (orange). However, the "Ours" method shows a more consistent increase in iterations, while the "KL-only" method experiences a peak before decreasing. The "Ours" method's iterations start lower and reach higher values as the sample complexity increases, indicating a potentially more efficient or robust approach.
### Key Observations
- The "Ours" method consistently requires fewer iterations than the "KL-only" method across all sample complexities.
- The "KL-only" method shows a peak in iterations at a sample complexity of around 22, after which the iterations decrease.
- The "Ours" method's iterations start lower and reach higher values as the sample complexity increases.
### Interpretation
The heatmap suggests that the "Ours" method is more efficient in terms of the number of iterations required as the sample complexity increases. This could indicate that the "Ours" method is better at handling larger datasets or is more robust to variations in sample complexity. The "KL-only" method, while requiring fewer iterations overall, has a higher peak in iterations, which might suggest it is more sensitive to changes in sample complexity. The "Ours" method's more consistent increase in iterations could also imply that it is more stable and reliable in its performance.