\n
## Line Chart: Attention Weights for Different Models
### Overview
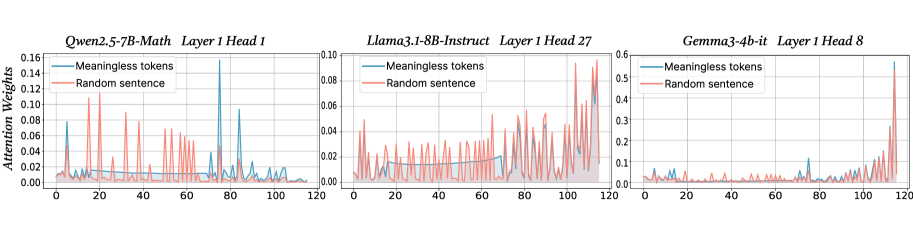
The image presents three line charts, each displaying attention weights over a sequence length of 120. Each chart represents a different language model: Owen2.5-7B-Math, Llama3.1-8B-Instruct, and Gemma3-4b-it. Each chart compares the attention weights assigned to "Meaningless tokens" and a "Random sentence". The y-axis represents "Attention Weights", and the x-axis represents the sequence position from 0 to 120.
### Components/Axes
* **X-axis:** Sequence Position (0 to 120) - common to all three charts.
* **Y-axis:** Attention Weights (varying scales for each chart).
* Owen2.5-7B-Math: 0 to 0.14
* Llama3.1-8B-Instruct: 0 to 0.10
* Gemma3-4b-it: 0 to 0.6
* **Legends:**
* "Meaningless tokens" (represented by a blue line)
* "Random sentence" (represented by an orange line)
* **Titles:**
* Owen2.5-7B-Math Layer 1 Head 1
* Llama3.1-8B-Instruct Layer 1 Head 27
* Gemma3-4b-it Layer 1 Head 8
### Detailed Analysis or Content Details
**Owen2.5-7B-Math (Layer 1 Head 1):**
The blue line ("Meaningless tokens") exhibits a series of sharp peaks and valleys, fluctuating between approximately 0.00 and 0.12. The orange line ("Random sentence") shows a similar pattern, but with generally lower attention weights, fluctuating between approximately 0.00 and 0.08. There are roughly 8-10 peaks in each line across the sequence length.
**Llama3.1-8B-Instruct (Layer 1 Head 27):**
The blue line ("Meaningless tokens") shows a more subdued pattern of fluctuations, generally staying between 0.00 and 0.08. The orange line ("Random sentence") is even flatter, mostly remaining below 0.04, with occasional spikes up to approximately 0.06. The fluctuations are less frequent and less pronounced than in the Owen2.5-7B-Math chart.
**Gemma3-4b-it (Layer 1 Head 8):**
The blue line ("Meaningless tokens") displays significant fluctuations, ranging from approximately 0.00 to 0.55. The orange line ("Random sentence") also shows substantial variation, ranging from approximately 0.00 to 0.35. This chart exhibits the most dramatic attention weight variations of the three. There are several large spikes in both lines, particularly around sequence positions 20, 40, 60, 80, and 100.
### Key Observations
* Gemma3-4b-it exhibits significantly higher attention weights overall compared to the other two models.
* Owen2.5-7B-Math shows the most frequent and pronounced fluctuations in attention weights.
* Llama3.1-8B-Instruct demonstrates the most stable and lowest attention weights.
* All three models show a pattern of fluctuating attention weights, suggesting that attention is dynamically shifting across the sequence.
### Interpretation
The charts illustrate how different language models allocate attention to "Meaningless tokens" and a "Random sentence" during processing. The varying scales of the y-axis suggest that the models have different sensitivities or internal representations of attention. The higher attention weights in Gemma3-4b-it might indicate a greater focus on specific tokens or a more complex attention mechanism. The fluctuations in all charts suggest that the models are not simply attending to the entire sequence equally but are dynamically focusing on different parts. The differences in fluctuation patterns could reflect variations in model architecture, training data, or the specific task they are designed for. The fact that attention is allocated to "Meaningless tokens" suggests that even seemingly irrelevant parts of the input sequence can influence the model's processing. The comparison between "Meaningless tokens" and a "Random sentence" could be used to understand how the models handle noise or irrelevant information.