## Line Charts: Attention Weights Across Transformer Models
### Overview
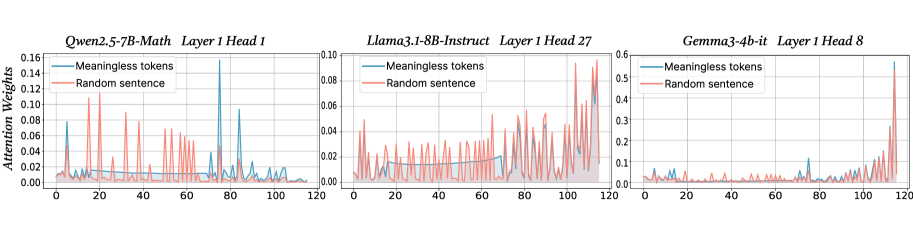
The image displays three horizontally arranged line charts, each comparing the "Attention Weights" assigned to two different input types ("Meaningless tokens" and "Random sentence") across token positions (0 to 120) for a specific layer and attention head of three different large language models. The charts illustrate how attention patterns differ between models and input conditions.
### Components/Axes
* **Titles (Top of each chart):**
* Left Chart: `Qwen2.5-7B-Math Layer 1 Head 1`
* Middle Chart: `Llama3.1-8B-Instruct Layer 1 Head 27`
* Right Chart: `Gemma3-4b-it Layer 1 Head 8`
* **Y-Axis (Vertical):** Labeled `Attention Weights` on the leftmost chart. The scale varies per chart.
* **X-Axis (Horizontal):** Represents token position, with markers at 0, 20, 40, 60, 80, 100, and 120. The axis is not explicitly labeled with text but is implied by the numerical markers.
* **Legend (Top-left corner within each chart's plot area):**
* Blue Line: `Meaningless tokens`
* Red Line: `Random sentence`
### Detailed Analysis
**1. Left Chart: Qwen2.5-7B-Math (Layer 1, Head 1)**
* **Y-Axis Scale:** 0.00 to 0.16.
* **Trend Verification:**
* **Meaningless tokens (Blue):** Shows a generally low baseline with one very prominent, sharp spike.
* **Random sentence (Red):** Exhibits frequent, moderate-amplitude fluctuations across the entire sequence.
* **Data Points & Observations:**
* The blue line remains below ~0.04 for most positions, except for a major peak reaching approximately **0.15** at token position **~80**.
* The red line shows consistent activity, with multiple peaks between **0.06 and 0.12**. Notable peaks occur around positions **10, 25, 45, and 70**.
* The two lines show little correlation; the major blue spike does not correspond to a major red peak.
**2. Middle Chart: Llama3.1-8B-Instruct (Layer 1, Head 27)**
* **Y-Axis Scale:** 0.00 to 0.10.
* **Trend Verification:**
* **Meaningless tokens (Blue):** Shows a gradual, noisy increase in attention weight from left to right.
* **Random sentence (Red):** Also shows a general upward trend with higher volatility and magnitude than the blue line.
* **Data Points & Observations:**
* Both lines start near 0.00 at position 0.
* The red line is consistently above the blue line for most of the sequence after position ~20.
* Both lines reach their highest values towards the end of the sequence (positions 100-120). The red line peaks near **0.10**, while the blue line peaks near **0.08**.
* The pattern suggests this head may be attending more strongly to later tokens in the sequence, especially for the "Random sentence" input.
**3. Right Chart: Gemma3-4b-it (Layer 1, Head 8)**
* **Y-Axis Scale:** 0.00 to 0.6 (Note: This scale is 6x larger than the middle chart and ~4x larger than the left chart).
* **Trend Verification:**
* **Meaningless tokens (Blue):** Remains extremely low and flat for the first ~100 tokens, then spikes dramatically.
* **Random sentence (Red):** Follows a similar pattern but with a less extreme final spike.
* **Data Points & Observations:**
* For positions 0 to ~100, both lines are near the baseline, mostly below **0.05**.
* A dramatic shift occurs after position 100. The blue line ("Meaningless tokens") spikes to the highest value in the entire image, approximately **0.55**, at position **~115**.
* The red line ("Random sentence") also spikes at the end, reaching about **0.20**.
* This head exhibits a very strong "end-of-sequence" attention bias, particularly for meaningless tokens.
### Key Observations
1. **Model-Specific Patterns:** Each model/head displays a unique attention signature. Qwen shows a single sharp spike, Llama shows a gradual build-up, and Gemma shows a late-sequence explosion.
2. **Input-Type Sensitivity:** The relationship between the blue and red lines differs per chart. In Llama, the "Random sentence" consistently draws more attention. In Gemma, the "Meaningless tokens" trigger the most extreme response at the end.
3. **Scale Disparity:** The y-axis scales are not uniform. The Gemma chart's maximum (0.6) is significantly higher than the others, indicating this head can produce much stronger attention weights.
4. **Spatial Grounding:** The legends are consistently placed in the top-left of each plot area. The most significant data features (spikes) are located in the right half of the x-axis for all charts.
### Interpretation
These charts provide a technical visualization of internal model mechanics, specifically how early-layer attention heads process different kinds of input. The data suggests:
* **Functional Specialization:** Different attention heads (even within Layer 1) develop specialized roles. The Qwen head (left) may act as a "spotlight" for specific token positions, the Llama head (middle) may track sequence progression, and the Gemma head (right) may be highly sensitive to sequence boundaries or padding.
* **Response to Nonsense:** The starkly different reactions to "Meaningless tokens" (blue) are telling. The Gemma head's extreme late spike could indicate a mechanism for handling or ignoring nonsensical input by concentrating attention at the sequence end, possibly before a generation step.
* **Architectural Insights:** The variance in patterns (spike vs. ramp vs. cliff) across models highlights how architectural choices and training objectives (e.g., math-focused for Qwen, instruct-tuned for Llama and Gemma) lead to different internal representations and processing strategies, even at the same layer depth.
**Language:** All text in the image is in English.