## Line Graphs: Attention Weights Comparison Across Models
### Overview
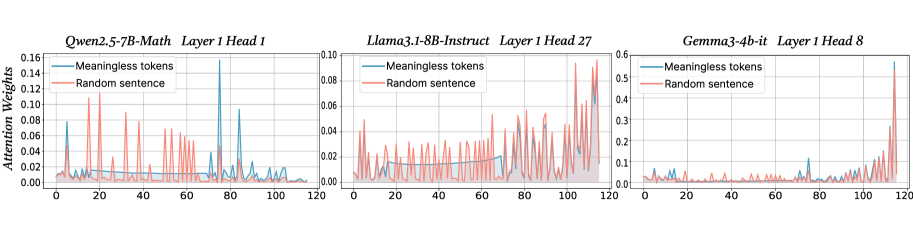
The image contains three separate line graphs comparing attention weights for "Meaningless tokens" (blue) and "Random sentence" (orange) across different transformer model architectures. Each graph represents a specific layer and attention head configuration, with x-axis showing token positions (0-120) and y-axis showing normalized attention weights.
### Components/Axes
1. **Models/Architectures**:
- Qwen2.5-7B-Math (Layer 1 Head 1)
- Llama3.1-8B-Instruct (Layer 1 Head 27)
- Gemma3-4b-it (Layer 1 Head 8)
2. **Axes**:
- X-axis: Token position (0-120)
- Y-axis: Attention weights (scaled differently per chart)
- Legends: Positioned at top-right of each chart
3. **Data Series**:
- Blue line: "Meaningless tokens"
- Orange line: "Random sentence"
### Detailed Analysis
#### Qwen2.5-7B-Math (Layer 1 Head 1)
- **Y-axis range**: 0-0.16
- **Blue line ("Meaningless tokens")**:
- Sharp peaks at ~10 (0.12), ~50 (0.14), ~90 (0.12)
- Baseline ~0.02-0.04
- **Orange line ("Random sentence")**:
- Peaks at ~15 (0.10), ~30 (0.08), ~70 (0.06)
- Baseline ~0.01-0.03
#### Llama3.1-8B-Instruct (Layer 1 Head 27)
- **Y-axis range**: 0-0.10
- **Blue line**:
- Gradual increase from 0.02 to 0.06
- Peaks at ~80 (0.07)
- **Orange line**:
- More variable with peaks at ~20 (0.05), ~60 (0.06), ~100 (0.05)
- Baseline ~0.03-0.04
#### Gemma3-4b-it (Layer 1 Head 8)
- **Y-axis range**: 0-0.5
- **Blue line**:
- Sharp peak at ~110 (0.45)
- Baseline ~0.01-0.03
- **Orange line**:
- Peak at ~115 (0.40)
- Baseline ~0.02-0.04
### Key Observations
1. **Model-Specific Patterns**:
- Qwen shows strongest attention peaks for "Meaningless tokens"
- Llama3.1 exhibits more distributed attention for both series
- Gemma3 has extreme attention concentration near end tokens
2. **Attention Distribution**:
- "Meaningless tokens" generally show higher peak attention values
- "Random sentence" demonstrates more consistent baseline attention
3. **Positional Trends**:
- Attention peaks often occur at token positions 10-120 across models
- Gemma3's attention weights reach highest absolute values (up to 0.45)
### Interpretation
The data suggests transformer models exhibit varying attention patterns depending on architecture and task. "Meaningless tokens" consistently receive stronger attention focus, particularly in Qwen2.5-7B-Math, indicating potential sensitivity to positional information. The extreme attention concentration in Gemma3-4b-it (0.45 peak) suggests possible overfitting to specific token positions. These patterns may reflect differences in model training objectives or architectural choices affecting how attention is distributed across input sequences.