## Heatmap: Classification Accuracies
### Overview
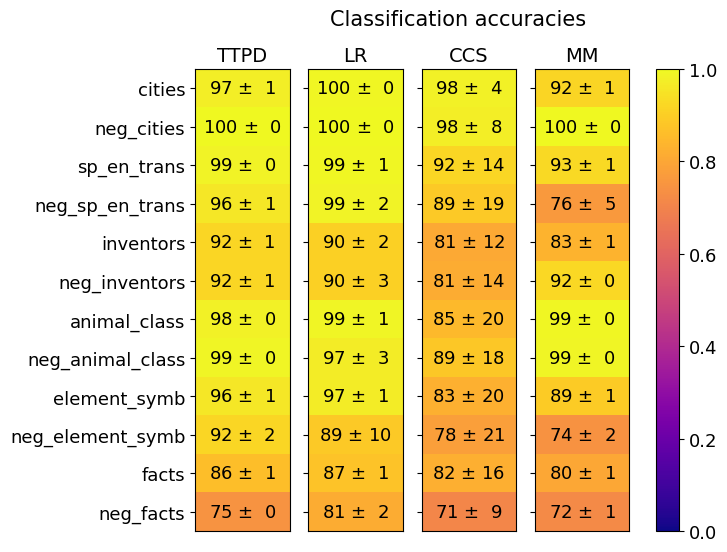
The image is a heatmap displaying classification accuracies for different models (TTPD, LR, CCS, MM) across various categories (cities, neg_cities, etc.). The color intensity represents the accuracy score, ranging from dark blue (low accuracy) to bright yellow (high accuracy). Each cell contains the accuracy value and its associated uncertainty (± value).
### Components/Axes
* **Title:** Classification accuracies
* **Columns (Models):** TTPD, LR, CCS, MM
* **Rows (Categories):** cities, neg\_cities, sp\_en\_trans, neg\_sp\_en\_trans, inventors, neg\_inventors, animal\_class, neg\_animal\_class, element\_symb, neg\_element\_symb, facts, neg\_facts
* **Colorbar:** Ranges from 0.0 (dark blue) to 1.0 (bright yellow), representing the classification accuracy score.
### Detailed Analysis
Here's a breakdown of the accuracy values for each model and category:
* **cities:**
* TTPD: 97 ± 1
* LR: 100 ± 0
* CCS: 98 ± 4
* MM: 92 ± 1
* **neg\_cities:**
* TTPD: 100 ± 0
* LR: 100 ± 0
* CCS: 98 ± 8
* MM: 100 ± 0
* **sp\_en\_trans:**
* TTPD: 99 ± 0
* LR: 99 ± 1
* CCS: 92 ± 14
* MM: 93 ± 1
* **neg\_sp\_en\_trans:**
* TTPD: 96 ± 1
* LR: 99 ± 2
* CCS: 89 ± 19
* MM: 76 ± 5
* **inventors:**
* TTPD: 92 ± 1
* LR: 90 ± 2
* CCS: 81 ± 12
* MM: 83 ± 1
* **neg\_inventors:**
* TTPD: 92 ± 1
* LR: 90 ± 3
* CCS: 81 ± 14
* MM: 92 ± 0
* **animal\_class:**
* TTPD: 98 ± 0
* LR: 99 ± 1
* CCS: 85 ± 20
* MM: 99 ± 0
* **neg\_animal\_class:**
* TTPD: 99 ± 0
* LR: 97 ± 3
* CCS: 89 ± 18
* MM: 99 ± 0
* **element\_symb:**
* TTPD: 96 ± 1
* LR: 97 ± 1
* CCS: 83 ± 20
* MM: 89 ± 1
* **neg\_element\_symb:**
* TTPD: 92 ± 2
* LR: 89 ± 10
* CCS: 78 ± 21
* MM: 74 ± 2
* **facts:**
* TTPD: 86 ± 1
* LR: 87 ± 1
* CCS: 82 ± 16
* MM: 80 ± 1
* **neg\_facts:**
* TTPD: 75 ± 0
* LR: 81 ± 2
* CCS: 71 ± 9
* MM: 72 ± 1
### Key Observations
* LR model achieves perfect accuracy (100 ± 0) for both "cities" and "neg\_cities" categories.
* CCS model generally has lower and more uncertain accuracies compared to other models, particularly for "neg\_sp\_en\_trans", "element\_symb", and "neg\_element\_symb".
* The "neg\_facts" category consistently shows the lowest accuracies across all models.
* The uncertainty (± value) is generally low for TTPD and LR, but higher for CCS, indicating more variability in CCS's performance.
### Interpretation
The heatmap provides a comparative view of the classification accuracies of four different models across twelve categories. The LR model appears to perform exceptionally well on "cities" and "neg\_cities". The CCS model exhibits lower and more variable performance, suggesting it may be less robust or require further tuning for these specific tasks. The "neg\_facts" category seems to be the most challenging for all models, indicating potential difficulties in classifying negative factual statements. The uncertainty values highlight the stability and reliability of each model, with CCS showing the highest degree of variability.