## Heatmap: Classification Accuracies
### Overview
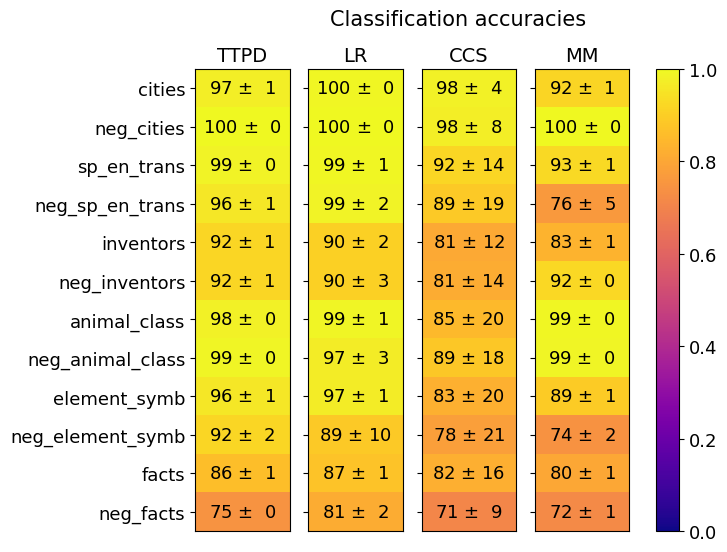
This image presents a heatmap displaying classification accuracies for four different models (TTPD, LR, CCS, MM) across twelve different categories and their negative counterparts. The color intensity represents the accuracy, with yellow indicating higher accuracy and dark blue indicating lower accuracy. Each cell also displays the accuracy value with a standard deviation.
### Components/Axes
* **Title:** "Classification accuracies" (centered at the top)
* **Columns:** Represent the four models: TTPD, LR, CCS, MM.
* **Rows:** Represent the twelve categories and their negative counterparts:
* cities
* neg\_cities
* sp\_en\_trans
* neg\_sp\_en\_trans
* inventors
* neg\_inventors
* animal\_class
* neg\_animal\_class
* element\_symb
* neg\_element\_symb
* facts
* neg\_facts
* **Colorbar:** Located on the right side, ranging from 0.0 (dark blue) to 1.0 (yellow), representing accuracy.
### Detailed Analysis
The heatmap displays accuracy values as "mean ± standard deviation". I will analyze each model's performance across the categories.
**TTPD (First Column):**
* cities: 97 ± 1
* neg\_cities: 100 ± 0
* sp\_en\_trans: 99 ± 0
* neg\_sp\_en\_trans: 96 ± 1
* inventors: 92 ± 1
* neg\_inventors: 92 ± 1
* animal\_class: 98 ± 0
* neg\_animal\_class: 99 ± 0
* element\_symb: 96 ± 1
* neg\_element\_symb: 92 ± 2
* facts: 86 ± 1
* neg\_facts: 75 ± 0
**LR (Second Column):**
* cities: 100 ± 0
* neg\_cities: 100 ± 0
* sp\_en\_trans: 99 ± 1
* neg\_sp\_en\_trans: 99 ± 2
* inventors: 90 ± 2
* neg\_inventors: 90 ± 3
* animal\_class: 99 ± 1
* neg\_animal\_class: 97 ± 3
* element\_symb: 97 ± 1
* neg\_element\_symb: 89 ± 10
* facts: 87 ± 1
* neg\_facts: 81 ± 2
**CCS (Third Column):**
* cities: 98 ± 4
* neg\_cities: 98 ± 8
* sp\_en\_trans: 92 ± 14
* neg\_sp\_en\_trans: 89 ± 19
* inventors: 81 ± 12
* neg\_inventors: 81 ± 14
* animal\_class: 85 ± 20
* neg\_animal\_class: 89 ± 18
* element\_symb: 83 ± 20
* neg\_element\_symb: 78 ± 21
* facts: 82 ± 16
* neg\_facts: 71 ± 9
**MM (Fourth Column):**
* cities: 92 ± 1
* neg\_cities: 100 ± 0
* sp\_en\_trans: 93 ± 1
* neg\_sp\_en\_trans: 76 ± 5
* inventors: 83 ± 1
* neg\_inventors: 92 ± 0
* animal\_class: 99 ± 0
* neg\_animal\_class: 99 ± 0
* element\_symb: 89 ± 1
* neg\_element\_symb: 74 ± 2
* facts: 80 ± 1
* neg\_facts: 72 ± 1
### Key Observations
* **High Accuracy:** The LR model consistently achieves the highest accuracies, particularly on 'cities' and 'neg\_cities' where it reaches 100% accuracy.
* **Negative Examples:** Generally, the models perform slightly better on the 'neg\_' versions of the categories compared to the positive versions. This is especially noticeable for the TTPD and LR models.
* **Low Accuracy:** The CCS and MM models exhibit lower accuracies, especially on 'neg\_sp\_en\_trans' and 'neg\_element\_symb'. The CCS model has the lowest accuracy on 'neg\_sp\_en\_trans' at 89 ± 19.
* **Standard Deviation:** The standard deviations are generally small, indicating consistent performance across the models. However, CCS shows larger standard deviations in several categories, suggesting more variability in its results.
### Interpretation
This heatmap provides a comparative analysis of four classification models across a range of categories. The data suggests that the LR model is the most robust and accurate, consistently achieving high scores across all categories. The TTPD model also performs well, but slightly less consistently than LR. CCS and MM models show lower overall accuracy and greater variability, indicating they may be less suitable for these classification tasks.
The slightly higher accuracy on 'neg\_' examples could indicate that the models are better at identifying what something *isn't* than what something *is*. This might be due to the way the negative examples are constructed or the inherent difficulty of defining positive categories.
The large standard deviation for CCS in some categories warrants further investigation. It could be due to issues with the training data, model parameters, or inherent limitations of the CCS algorithm. The heatmap effectively visualizes the performance differences between the models, allowing for a quick and easy comparison of their strengths and weaknesses.