# Technical Document Extraction: Performance Comparison Chart
## 1. Component Isolation
* **Header:** None present.
* **Main Chart Area:** A 2D line graph with a grid background, containing two data series.
* **Legend:** Located in the top-right quadrant of the chart area.
* **Axes:** Y-axis (left) and X-axis (bottom).
## 2. Axis and Label Extraction
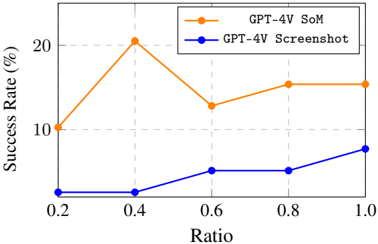
* **Y-Axis Title:** Success Rate (%)
* **Y-Axis Markers:** 10, 20 (Note: The axis starts at 0 based on the origin, though not explicitly labeled at the bottom-most point).
* **X-Axis Title:** Ratio
* **X-Axis Markers:** 0.2, 0.4, 0.6, 0.8, 1.0
## 3. Legend and Spatial Grounding
* **Legend Location:** Top-right [approximate normalized coordinates: x=0.65 to 0.95, y=0.75 to 0.95].
* **Series 1:** Orange line with circular markers. Label: **GPT-4V SoM**
* **Series 2:** Blue line with circular markers. Label: **GPT-4V Screenshot**
## 4. Trend Verification and Data Extraction
### Series 1: GPT-4V SoM (Orange Line)
* **Visual Trend:** The line starts at a moderate level, peaks sharply at Ratio 0.4, drops significantly at Ratio 0.6, and then recovers slightly to plateau between 0.8 and 1.0. It consistently maintains a higher success rate than the blue series.
* **Data Points:**
* Ratio 0.2: ~10.5%
* Ratio 0.4: ~20.5% (Peak)
* Ratio 0.6: ~13.0%
* Ratio 0.8: ~15.5%
* Ratio 1.0: ~15.5%
### Series 2: GPT-4V Screenshot (Blue Line)
* **Visual Trend:** The line starts at a very low baseline, remains flat between Ratio 0.2 and 0.4, and then shows a steady upward slope from Ratio 0.4 through to Ratio 1.0.
* **Data Points:**
* Ratio 0.2: ~2.5%
* Ratio 0.4: ~2.5%
* Ratio 0.6: ~5.0%
* Ratio 0.8: ~5.0%
* Ratio 1.0: ~8.0%
## 5. Reconstructed Data Table
| Ratio (X) | GPT-4V SoM Success Rate (%) | GPT-4V Screenshot Success Rate (%) |
| :--- | :--- | :--- |
| 0.2 | ~10.5 | ~2.5 |
| 0.4 | ~20.5 | ~2.5 |
| 0.6 | ~13.0 | ~5.0 |
| 0.8 | ~15.5 | ~5.0 |
| 1.0 | ~15.5 | ~8.0 |
## 6. Summary of Findings
The chart compares the performance of two methods, "GPT-4V SoM" and "GPT-4V Screenshot," across varying "Ratios."
* **Superiority:** The "GPT-4V SoM" (Orange) method significantly outperforms the "GPT-4V Screenshot" (Blue) method at every measured ratio.
* **Peak Performance:** The SoM method reaches its maximum efficiency at a Ratio of 0.4, achieving over a 20% success rate.
* **Growth Pattern:** While the SoM method is volatile, the Screenshot method shows a slow but consistent improvement as the Ratio increases from 0.4 to 1.0.