\n
## Bar Chart: Decoding Speed vs. Verification Width for Different Decoding Methods
### Overview
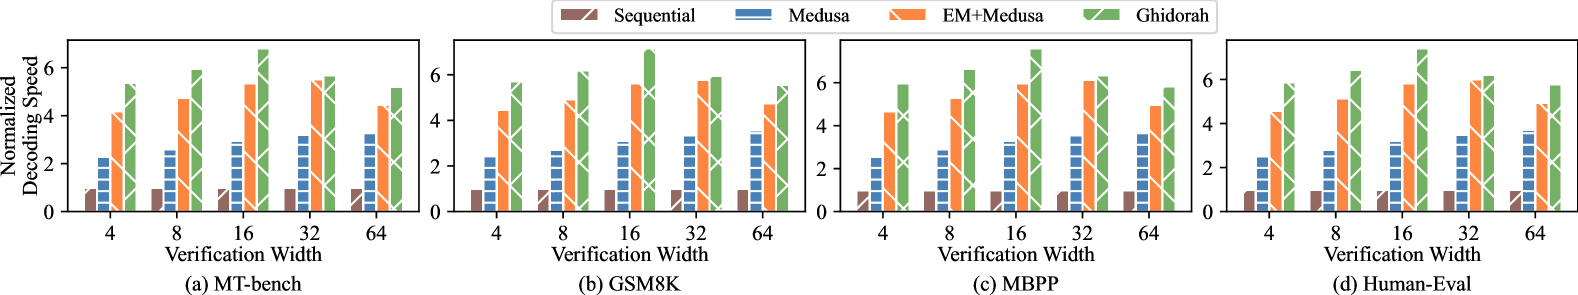
The image presents four bar charts, each comparing the normalized decoding speed of four different decoding methods – Sequential, Medusa, EM+Medusa, and Ghidorah – across varying verification widths. Each chart represents a different dataset: (a) MT-bench, (b) GSM8K, (c) MBPP, and (d) Human-Eval. The y-axis represents the normalized decoding speed, while the x-axis represents the verification width.
### Components/Axes
* **Y-axis Label:** "Normalized Decoding Speed" (Scale ranges from 0 to approximately 6)
* **X-axis Label:** "Verification Width" (Markers: 4, 8, 16, 32, 64)
* **Legend:** Located at the top-right of the image.
* Sequential (Color: Light Red/Orange)
* Medusa (Color: Blue)
* EM+Medusa (Color: Light Green)
* Ghidorah (Color: Light Purple)
* **Sub-chart Labels:**
* (a) MT-bench (Bottom-left)
* (b) GSM8K (Bottom-center-left)
* (c) MBPP (Bottom-center-right)
* (d) Human-Eval (Bottom-right)
### Detailed Analysis or Content Details
**Chart (a) MT-bench:**
* **Sequential:** The bars generally hover around 5.0, with slight variations. Values are approximately: 4.8 (width 4), 5.0 (width 8), 5.2 (width 16), 5.1 (width 32), 5.3 (width 64).
* **Medusa:** The bars are consistently low, around 1.0-1.5. Values are approximately: 1.2 (width 4), 1.3 (width 8), 1.4 (width 16), 1.3 (width 32), 1.5 (width 64).
* **EM+Medusa:** Bars are around 2.0-2.5. Values are approximately: 2.1 (width 4), 2.3 (width 8), 2.4 (width 16), 2.2 (width 32), 2.5 (width 64).
* **Ghidorah:** Bars are around 3.0-3.5. Values are approximately: 3.1 (width 4), 3.3 (width 8), 3.4 (width 16), 3.2 (width 32), 3.5 (width 64).
**Chart (b) GSM8K:**
* **Sequential:** Bars are around 5.5-6.0. Values are approximately: 5.6 (width 4), 5.8 (width 8), 5.9 (width 16), 5.7 (width 32), 6.0 (width 64).
* **Medusa:** Bars are around 3.0-4.0. Values are approximately: 3.2 (width 4), 3.5 (width 8), 3.8 (width 16), 3.6 (width 32), 3.9 (width 64).
* **EM+Medusa:** Bars are around 4.0-5.0. Values are approximately: 4.1 (width 4), 4.4 (width 8), 4.7 (width 16), 4.5 (width 32), 4.9 (width 64).
* **Ghidorah:** Bars are around 5.0-5.5. Values are approximately: 5.1 (width 4), 5.3 (width 8), 5.4 (width 16), 5.2 (width 32), 5.5 (width 64).
**Chart (c) MBPP:**
* **Sequential:** Bars are around 5.5-6.0. Values are approximately: 5.6 (width 4), 5.8 (width 8), 5.9 (width 16), 5.7 (width 32), 6.0 (width 64).
* **Medusa:** Bars are around 3.0-4.0. Values are approximately: 3.2 (width 4), 3.5 (width 8), 3.8 (width 16), 3.6 (width 32), 3.9 (width 64).
* **EM+Medusa:** Bars are around 4.0-5.0. Values are approximately: 4.1 (width 4), 4.4 (width 8), 4.7 (width 16), 4.5 (width 32), 4.9 (width 64).
* **Ghidorah:** Bars are around 5.0-5.5. Values are approximately: 5.1 (width 4), 5.3 (width 8), 5.4 (width 16), 5.2 (width 32), 5.5 (width 64).
**Chart (d) Human-Eval:**
* **Sequential:** Bars are around 5.0-5.5. Values are approximately: 5.1 (width 4), 5.3 (width 8), 5.4 (width 16), 5.2 (width 32), 5.5 (width 64).
* **Medusa:** Bars are around 2.5-3.5. Values are approximately: 2.6 (width 4), 2.9 (width 8), 3.2 (width 16), 3.0 (width 32), 3.4 (width 64).
* **EM+Medusa:** Bars are around 3.5-4.5. Values are approximately: 3.6 (width 4), 3.9 (width 8), 4.2 (width 16), 3.8 (width 32), 4.4 (width 64).
* **Ghidorah:** Bars are around 4.5-5.0. Values are approximately: 4.6 (width 4), 4.8 (width 8), 4.9 (width 16), 4.7 (width 32), 5.0 (width 64).
### Key Observations
* Sequential consistently demonstrates the highest decoding speed across all datasets.
* Medusa consistently exhibits the lowest decoding speed.
* EM+Medusa and Ghidorah fall between Sequential and Medusa in terms of decoding speed.
* For all methods, decoding speed generally increases with increasing verification width, but the increase appears to plateau at higher widths (32 and 64).
* The differences in decoding speed between methods are more pronounced in the MT-bench dataset compared to the others.
### Interpretation
The data suggests that the Sequential decoding method is the most efficient in terms of decoding speed for all tested datasets. The addition of EM to Medusa (EM+Medusa) and the use of Ghidorah improve decoding speed compared to Medusa alone, but they do not reach the performance of Sequential. The verification width has a positive correlation with decoding speed, indicating that increasing the verification process enhances performance, but the gains diminish at higher widths. The varying performance across datasets suggests that the effectiveness of each decoding method is dependent on the specific characteristics of the data being processed. The relatively small differences in performance between verification widths of 32 and 64 suggest that there may be a point of diminishing returns in increasing the verification process. This information is valuable for optimizing decoding strategies in various natural language processing tasks.