## Heatmaps: Frequency vs. Angle
### Overview
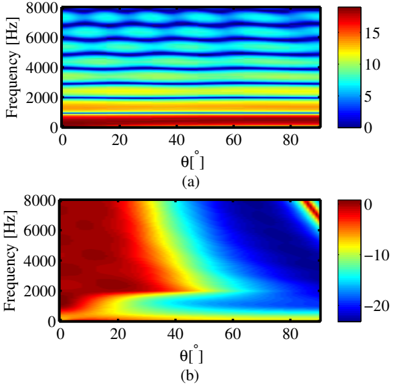
The image contains two heatmaps, (a) and (b), both displaying the relationship between frequency (0-8000 Hz) and angle θ (0-90 degrees). The heatmaps use color to represent a third, unspecified variable. Heatmap (a) uses a color scale from 0 to 15, while heatmap (b) uses a color scale from -20 to 10.
### Components/Axes
**Heatmap (a):**
* **X-axis:** Angle θ in degrees, ranging from 0 to 90 degrees. Axis markers are present at 0, 20, 40, 60, and 80 degrees.
* **Y-axis:** Frequency in Hz, ranging from 0 to 8000 Hz. Axis markers are present at 0, 2000, 4000, 6000, and 8000 Hz.
* **Colorbar:** Located on the right side of the heatmap, ranging from 0 (dark blue) to 15 (dark red).
* **Title:** (a)
**Heatmap (b):**
* **X-axis:** Angle θ in degrees, ranging from 0 to 90 degrees. Axis markers are present at 0, 20, 40, 60, and 80 degrees.
* **Y-axis:** Frequency in Hz, ranging from 0 to 8000 Hz. Axis markers are present at 0, 2000, 4000, 6000, and 8000 Hz.
* **Colorbar:** Located on the right side of the heatmap, ranging from -20 (dark blue) to 10 (dark red).
* **Title:** (b)
### Detailed Analysis
**Heatmap (a):**
* **Trend:** At lower frequencies (below approximately 1000 Hz), the color is consistently red, indicating a high value (close to 15) across all angles. Above 2000 Hz, the heatmap shows a series of alternating bands of higher and lower values, creating a wavy pattern. The bands are roughly horizontal, indicating that the frequency is the primary determinant of the value, with angle having a modulating effect.
* **Specific Values:**
* Frequency 0-1000 Hz: Value ~15 across all angles.
* Frequency 2000 Hz: Value oscillates between ~5 and ~10 as angle changes.
* Frequency 4000 Hz: Value oscillates between ~5 and ~10 as angle changes.
* Frequency 6000 Hz: Value oscillates between ~5 and ~10 as angle changes.
* Frequency 8000 Hz: Value oscillates between ~5 and ~10 as angle changes.
**Heatmap (b):**
* **Trend:** At lower frequencies (below approximately 2000 Hz), the color transitions from red (high value) at low angles to blue (low value) at higher angles. Above 2000 Hz, the heatmap shows a more complex pattern, with a region of high values (red/yellow) extending from low angles to higher frequencies, and a region of low values (blue) at higher angles and frequencies.
* **Specific Values:**
* Frequency 0-1000 Hz: Value transitions from ~10 at 0 degrees to ~-20 at 90 degrees.
* Frequency 2000 Hz: Value transitions from ~0 at 0 degrees to ~-20 at 90 degrees.
* Frequency 4000 Hz: Value transitions from ~5 at 20 degrees to ~-10 at 90 degrees.
* Frequency 6000 Hz: Value transitions from ~0 at 20 degrees to ~-5 at 90 degrees.
* Frequency 8000 Hz: Value transitions from ~-5 at 20 degrees to ~-5 at 90 degrees.
### Key Observations
* Heatmap (a) shows a relatively consistent high value at low frequencies, with oscillating patterns at higher frequencies.
* Heatmap (b) shows a more complex relationship between frequency, angle, and value, with a clear transition from high to low values as angle increases, particularly at lower frequencies.
### Interpretation
The heatmaps likely represent the magnitude of some physical quantity (e.g., sound pressure level, signal strength) as a function of frequency and angle. Heatmap (a) suggests that the quantity is strong at low frequencies, with some interference patterns at higher frequencies. Heatmap (b) suggests that the quantity is strongly dependent on angle, particularly at lower frequencies, possibly indicating directionality or attenuation effects. The specific nature of the quantity and the physical setup would be needed to provide a more detailed interpretation.