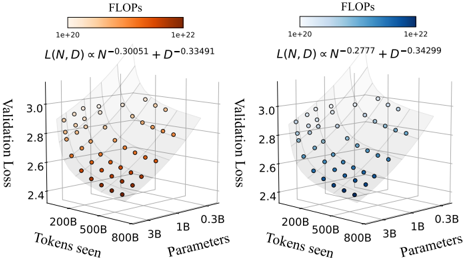
## 3D Scatter Plots: Validation Loss vs. Tokens Seen and Parameters
### Overview
The image presents two 3D scatter plots, each visualizing the relationship between validation loss, tokens seen, and the number of parameters. The plots differ in the exponents used in the formula L(N, D) ∝ N^exponent + D^exponent, and the color of the data points represents the FLOPs (Floating Point Operations per second).
### Components/Axes
**Left Plot:**
* **X-axis:** Tokens seen, labeled with values 200B, 500B, 800B, and 3B.
* **Y-axis:** Validation Loss, ranging from 2.4 to 3.0.
* **Z-axis:** Parameters, labeled with values 0.3B, 1B, and 3B.
* **Color Legend (Top-Left):** FLOPs, ranging from 1e+20 (light orange) to 1e+22 (dark orange).
* **Formula:** L(N, D) ∝ N^-0.30051 + D^-0.33491
**Right Plot:**
* **X-axis:** Tokens seen, labeled with values 200B, 500B, 800B, and 3B.
* **Y-axis:** Validation Loss, ranging from 2.4 to 3.0.
* **Z-axis:** Parameters, labeled with values 0.3B, 1B, and 3B.
* **Color Legend (Top-Right):** FLOPs, ranging from 1e+20 (light blue) to 1e+22 (dark blue).
* **Formula:** L(N, D) ∝ N^-0.2777 + D^-0.34299
### Detailed Analysis
**Left Plot (Orange):**
* **Trend:** The validation loss generally decreases as both tokens seen and parameters increase, forming a curved surface.
* **Data Points:**
* At 200B tokens seen and 0.3B parameters, validation loss ranges from approximately 2.8 to 3.0 (light orange, lower FLOPs).
* At 3B tokens seen and 3B parameters, validation loss is approximately 2.4 to 2.6 (dark orange, higher FLOPs).
* The lowest validation loss values (darkest orange) are clustered towards the higher tokens seen and higher parameter values.
**Right Plot (Blue):**
* **Trend:** Similar to the left plot, the validation loss decreases as both tokens seen and parameters increase.
* **Data Points:**
* At 200B tokens seen and 0.3B parameters, validation loss ranges from approximately 2.8 to 3.0 (light blue, lower FLOPs).
* At 3B tokens seen and 3B parameters, validation loss is approximately 2.4 to 2.6 (dark blue, higher FLOPs).
* The lowest validation loss values (darkest blue) are clustered towards the higher tokens seen and higher parameter values.
### Key Observations
* Both plots show a similar trend: increasing tokens seen and parameters leads to lower validation loss.
* The color gradient indicates that higher FLOPs are generally associated with lower validation loss, especially at higher tokens seen and parameter values.
* The exponents in the formulas for L(N, D) are slightly different between the two plots, which may contribute to subtle differences in the shape of the curved surface and the distribution of data points.
### Interpretation
The plots demonstrate the relationship between model size (parameters), training data size (tokens seen), computational cost (FLOPs), and model performance (validation loss). The data suggests that increasing both the size of the model and the amount of training data generally leads to improved performance, as indicated by the lower validation loss. The color gradient further suggests that achieving lower validation loss often requires higher computational cost (FLOPs). The difference in exponents between the two plots could represent different optimization strategies or model architectures, leading to slightly different trade-offs between model size, data size, and computational cost.