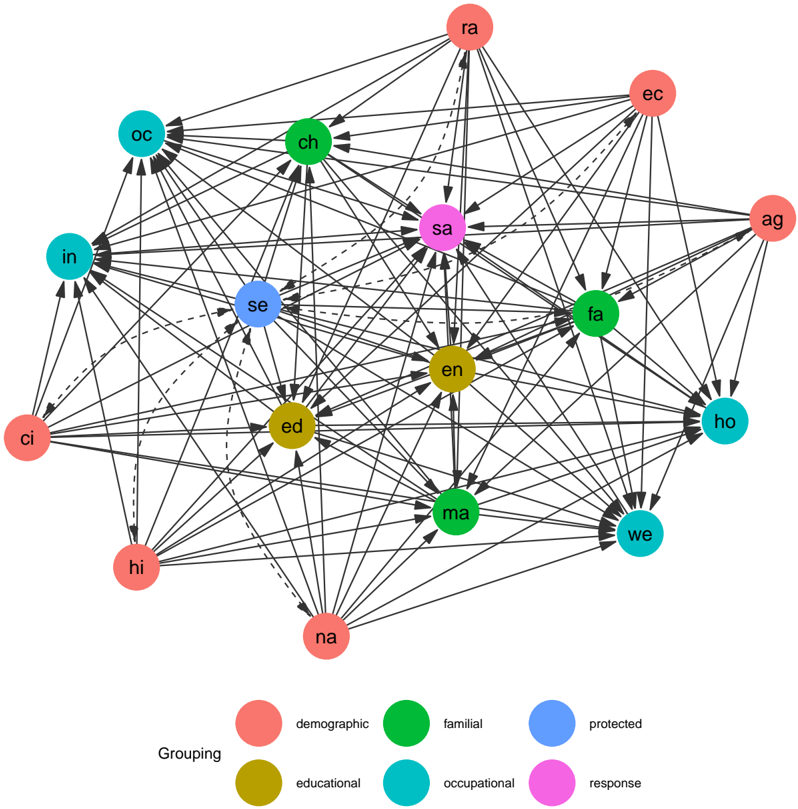
## Network Diagram: Factor Relationships
### Overview
The image is a network diagram illustrating relationships between various factors, categorized into demographic, familial, protected, educational, occupational, and response groups. Nodes represent factors, and edges (arrows) indicate the direction of influence or relationship between them. The diagram shows the interconnectedness of these factors.
### Components/Axes
* **Nodes:** Represented by colored circles, each labeled with a two-letter abbreviation.
* **Edges:** Represented by arrows, indicating the direction of influence between factors. Solid lines indicate a strong relationship, while dashed lines indicate a weaker relationship.
* **Grouping Legend (Bottom-Left):**
* Red: Demographic
* Green: Familial
* Blue: Protected
* Gold: Educational
* Teal: Occupational
* Pink: Response
### Detailed Analysis or ### Content Details
**Node Identification and Grouping:**
* **Demographic (Red):**
* ra
* ag
* hi
* ci
* na
* **Familial (Green):**
* ch
* fa
* ma
* **Protected (Blue):**
* se
* **Educational (Gold):**
* ed
* en
* **Occupational (Teal):**
* oc
* in
* we
* ho
* **Response (Pink):**
* sa
* ec
**Edge Analysis (Relationships):**
Due to the complexity of the diagram, a comprehensive list of all connections is impractical. However, some key observations can be made:
* **Central Node:** The 'sa' (Response) node appears to be a central hub, receiving connections from almost all other nodes.
* **Demographic Influence:** The demographic nodes (ra, ag, hi, ci, na) have numerous outgoing connections, suggesting they influence many other factors.
* **Familial Connections:** The familial nodes (ch, fa, ma) are interconnected and also influence other factors.
* **Dashed Lines:** Dashed lines indicate weaker relationships. For example, there are dashed lines between 'ci' and 'se', 'ci' and 'sa', 'se' and 'ra', 'na' and 'sa'.
**Specific Connections (Examples):**
* 'ra' (Demographic) has outgoing connections to 'sa', 'ec', 'fa', 'ho', 'en', 'ma', 'oc', 'in', 'ed', 'we'.
* 'sa' (Response) receives connections from 'ra', 'ec', 'ch', 'se', 'ed', 'ci', 'hi', 'na', 'fa', 'ma', 'oc', 'in', 'we', 'ho', 'ag'.
* 'ci' (Demographic) has outgoing connections to 'oc', 'in', 'ed', 'en', 'sa'.
### Key Observations
* The 'sa' (Response) node acts as a central point of convergence, indicating that response factors are influenced by a wide range of other factors.
* Demographic factors (red nodes) appear to have a broad influence across the network.
* The diagram highlights the interconnectedness of various factors, suggesting that changes in one area can have ripple effects throughout the system.
### Interpretation
The network diagram illustrates a complex system of relationships between demographic, familial, protected, educational, occupational, and response factors. The central role of the 'sa' (Response) node suggests that responses are influenced by a multitude of factors across different categories. The numerous connections originating from demographic factors indicate their pervasive influence. The presence of both strong (solid line) and weak (dashed line) relationships suggests varying degrees of influence between factors.
This diagram could represent a model of social, economic, or health-related factors, where understanding the relationships between these factors is crucial for effective intervention or policy-making. The diagram emphasizes the importance of considering the interconnectedness of various factors when analyzing complex systems.