TECHNICAL ASSET FINGERPRINT
56d380f88fc8e7c31edde366
Click to view fullscreen
Press ESC or click to close
FOUND IN PAPERS
EXPERT: gemini-2.5-flash-free VERSION 1
RUNTIME: google-free/gemini-2.5-flash
INTEL_VERIFIED
## Diagram Type: Directed Network Graph of Interconnected Factors
### Overview
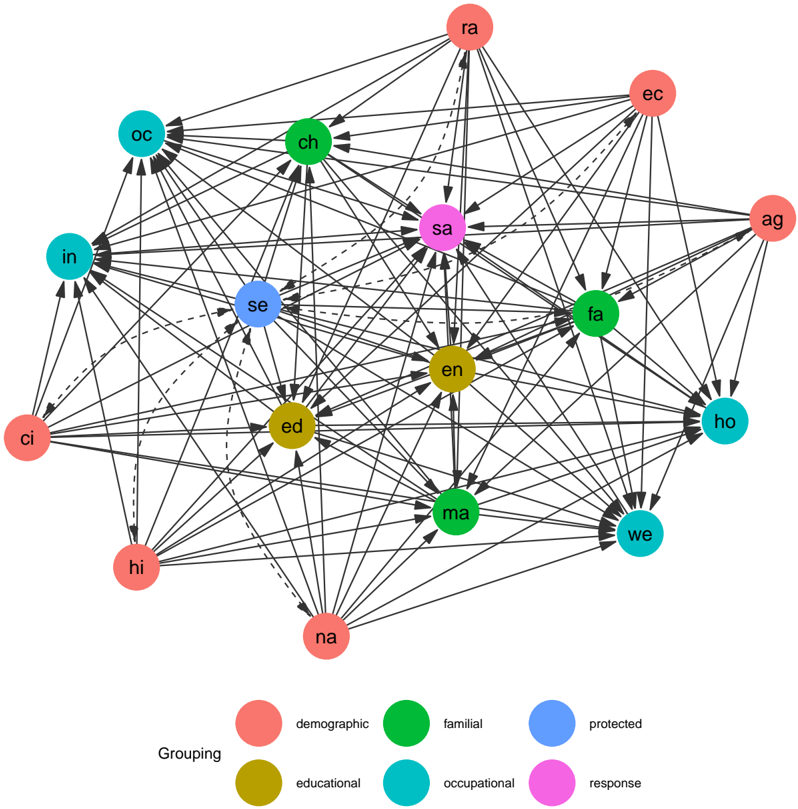
This image displays a directed network graph, also known as a sociogram or a causal loop diagram, illustrating relationships between 17 distinct factors. Each factor is represented by a circular node with a two-letter code, and these nodes are color-coded into six different "Grouping" categories. The relationships between factors are shown by directed edges (arrows), which can be either solid or dashed lines, indicating different types of influence or connection. The diagram aims to visualize the complex interplay and dependencies among these factors.
### Components/Axes
The diagram consists of a central network visualization and a legend located at the bottom-left.
**Nodes:**
There are 17 circular nodes, each containing a two-letter alphanumeric code. The nodes are arranged in a roughly elliptical pattern, with some nodes appearing more central than others.
**Edges:**
Connections between nodes are represented by directed arrows.
* **Solid lines with arrows:** Indicate a primary or strong directed relationship from the source node to the target node.
* **Dashed lines with arrows:** Indicate a secondary, perhaps weaker, indirect, or different type of directed relationship from the source node to the target node.
**Legend (Bottom-Left):**
The legend, labeled "Grouping", defines the color-coding for the nodes:
* **Red (salmon/coral):** `demographic`
* **Green (forest green):** `familial`
* **Blue (sky blue):` `protected`
* **Gold (dark yellow/ochre):** `educational`
* **Teal (cyan/turquoise):** `occupational`
* **Magenta (bright pink):** `response`
### Detailed Analysis
**Node List and Groupings:**
1. **Demographic (Red):**
* `ra` (top-center)
* `ec` (top-right)
* `ag` (far right)
* `ci` (mid-left)
* `hi` (bottom-left)
* `na` (bottom-center)
2. **Familial (Green):**
* `ch` (top-left)
* `fa` (mid-right)
* `ma` (bottom-right)
3. **Protected (Blue):**
* `se` (center-left)
4. **Educational (Gold):**
* `en` (center-right)
* `ed` (center-left, below `se`)
5. **Occupational (Teal):**
* `oc` (top-left, above `in`)
* `in` (mid-left, above `ci`)
* `ho` (far right, below `ag`)
* `we` (bottom-right, below `ma`)
6. **Response (Magenta):**
* `sa` (central)
**Connectivity and Trends:**
The diagram is highly interconnected, with most nodes having multiple incoming and outgoing edges.
* **Centrality of 'sa' (Response - Magenta):** The node `sa` appears to be a central hub. It has numerous incoming and outgoing solid and dashed connections from almost all other groupings.
* **Incoming to `sa` (Solid):** Receives solid connections from almost all other nodes.
* **Incoming to `sa` (Dashed):** From `ra`, `se`, `ed`.
* **Outgoing from `sa` (Solid):** Sends solid connections to almost all other nodes.
* **Outgoing from `sa` (Dashed):** To `ra`, `se`, `ed`.
* **High Connectivity of Educational Nodes (`en`, `ed` - Gold):**
* Both `en` and `ed` are highly connected, receiving and sending solid arrows to most other nodes across all groupings, including `sa`.
* Both `en` and `ed` have dashed connections to and from `sa`, `ra`, and `se`.
* **Protected Node (`se` - Blue):**
* `se` is also highly connected, receiving and sending solid arrows to most other nodes, including `sa`, `en`, `ed`, and many demographic, familial, and occupational nodes.
* It also has dashed connections to and from `sa`, `ra`, and `ed`.
* **Demographic Nodes (Red):**
* Nodes like `ra`, `ec`, `ag`, `ci`, `hi`, `na` are extensively connected to nodes from all other groupings, both as sources and targets of influence.
* `ra` specifically has several dashed connections, both incoming and outgoing, involving `sa`, `se`, `ed`, `en`.
* **Familial Nodes (Green):**
* `ch`, `fa`, `ma` are well-integrated into the network, showing connections to and from various other groupings, including `sa`, `en`, `ed`, and demographic/occupational nodes.
* **Occupational Nodes (Teal):**
* `oc`, `in`, `ho`, `we` are also highly connected, demonstrating influences on and from other categories, particularly `sa`, `en`, `ed`, and demographic/familial nodes.
* **Dashed Line Observations:**
* Dashed lines are less numerous than solid lines.
* They primarily involve `sa` (response), `ra` (demographic), `se` (protected), `en` (educational), and `ed` (educational).
* Specific dashed connections observed:
* `ra` <--> `sa` (bidirectional)
* `ra` <--> `se` (bidirectional)
* `ra` <--> `ed` (bidirectional)
* `ra` <--> `en` (bidirectional)
* `se` <--> `sa` (bidirectional)
* `se` <--> `ed` (bidirectional)
* `ed` <--> `sa` (bidirectional)
* `en` <--> `sa` (bidirectional)
* `ci` --> `in` (unidirectional)
* `ci` --> `oc` (unidirectional)
* `hi` --> `in` (unidirectional)
* `na` --> `in` (unidirectional)
* `na` --> `oc` (unidirectional)
* `ch` --> `oc` (unidirectional)
* `fa` --> `ho` (unidirectional)
* `ma` --> `we` (unidirectional)
* `ec` --> `ag` (unidirectional)
* `ag` --> `ec` (unidirectional)
### Key Observations
* **High Density of Connections:** The network is extremely dense, with almost every node connected to almost every other node, often bidirectionally, via solid lines. This suggests a highly interdependent system where factors influence each other extensively.
* **Centrality of 'Response' (sa):** The `response` node (`sa`) is positioned centrally and exhibits the highest degree of connectivity, both incoming and outgoing, across all groupings. This suggests it is a critical factor, influenced by and influencing nearly all other elements in the system.
* **Importance of 'Educational' (en, ed) and 'Protected' (se) Factors:** These nodes also show very high connectivity, indicating their significant role in the network's dynamics.
* **Distinction of Edge Types:** The presence of both solid and dashed lines implies a qualitative difference in the relationships. Solid lines likely represent direct, strong, or primary influences, while dashed lines might represent indirect, weaker, conditional, or perhaps even negative influences.
* **Bidirectional Relationships:** Many connections are bidirectional (an arrow in both directions), indicating mutual influence between factors.
* **Inter-group Connectivity:** There are no isolated groupings; all six categories are extensively interconnected.
### Interpretation
This network diagram illustrates a complex system where various `demographic`, `familial`, `protected`, `educational`, `occupational`, and `response` factors are deeply intertwined.
The `response` (magenta `sa`) node's central position and extensive connections strongly suggest it is the primary outcome or a critical mediating factor within this system. It is influenced by virtually every other factor and, in turn, influences them. This could imply that `response` is a comprehensive measure or a key intervention point that reflects and affects the entire ecosystem of factors.
The high connectivity of `educational` (gold `en`, `ed`) and `protected` (blue `se`) factors indicates their fundamental importance. They are not merely influenced by other factors but also exert significant influence across the network, potentially acting as foundational elements or key drivers of change. For instance, educational attainment (`en`, `ed`) might be a prerequisite for certain occupational outcomes or might influence demographic trends. Similarly, `protected` factors (`se`) could represent policies, rights, or support systems that broadly impact individuals and communities.
The distinction between solid and dashed lines is crucial for a deeper understanding. If solid lines represent direct causal links and dashed lines represent indirect or moderating effects, then the diagram highlights both direct pathways and more nuanced, perhaps conditional, relationships. For example, the dashed connections involving `ra` (demographic) with `sa` (response), `se` (protected), `ed` (educational), and `en` (educational) might suggest that demographic characteristics have complex, perhaps indirect or context-dependent, influences on these key areas. The specific unidirectional dashed lines from `ci`, `hi`, `na`, `ch`, `fa`, `ma`, `ec`, `ag` to occupational or other demographic nodes could indicate specific, perhaps less direct or less strong, influences within those domains.
Overall, the diagram depicts a highly integrated system where changes in one factor are likely to propagate throughout the network, affecting many other factors and ultimately influencing the central `response` element. Understanding the nature of these influences (solid vs. dashed) would be key to identifying leverage points for intervention or predicting systemic outcomes. The diagram emphasizes the need for a holistic approach when analyzing or addressing issues related to these interconnected factors, as isolating any single factor would likely overlook critical dependencies.
DECODING INTELLIGENCE...