## Network Diagram: Social Network Analysis
### Overview
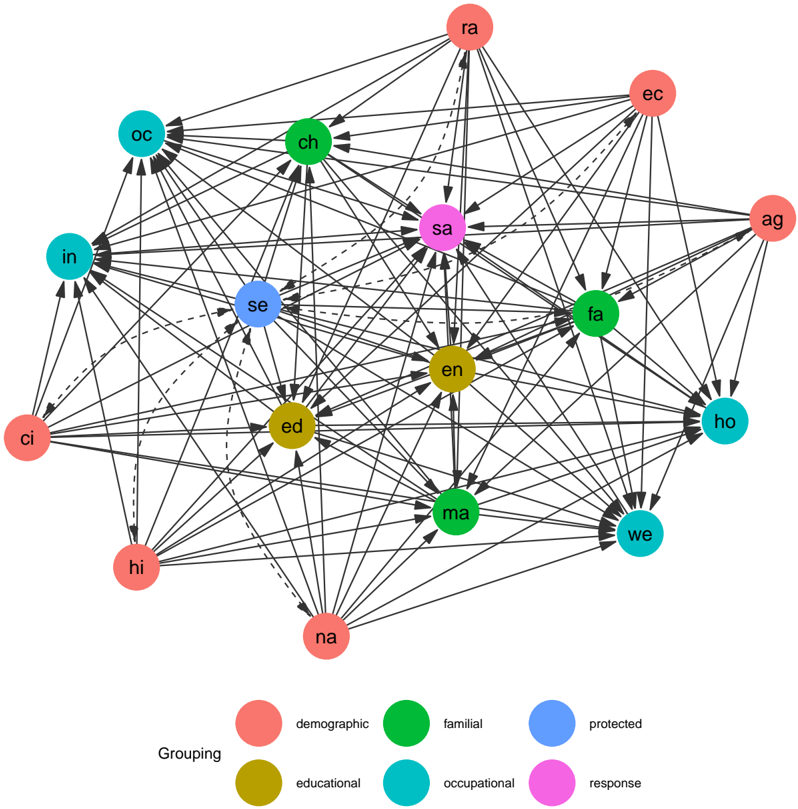
The image presents a network diagram illustrating relationships between various nodes categorized by color. The nodes are interconnected by lines, with line styles (solid, dashed, dotted) potentially indicating different types or strengths of relationships. The diagram appears to represent a social network or a system of interconnected entities, with nodes grouped into demographic, familial, protected, educational, occupational, and response categories.
### Components/Axes
The diagram consists of the following components:
* **Nodes:** Represented by circles, each labeled with a two-letter code (e.g., "ci", "ra", "en").
* **Edges:** Lines connecting the nodes, indicating relationships between them. Edge styles vary (solid, dashed, dotted).
* **Color Coding:** Nodes are colored to represent different groupings:
* Red: Demographic
* Green: Familial
* Blue: Protected
* Yellow: Educational
* Teal/Cyan: Occupational
* Purple: Response
* **Legend:** Located at the bottom of the image, providing a key to the color coding.
* **Node Labels:** Each node is labeled with a two-letter abbreviation.
### Detailed Analysis
The diagram contains 16 nodes, categorized as follows:
* **Demographic (Red):** ci, hi, na
* **Familial (Green):** ra, ch, fa, ag
* **Protected (Blue):** in, se, we, ho
* **Educational (Yellow):** oc, ed
* **Occupational (Teal/Cyan):** sa
* **Response (Purple):** en, ma
Here's a breakdown of the connections (approximate based on visual inspection):
* **ci (Demographic):** Connected to in, se, ed, hi.
* **hi (Demographic):** Connected to ci, na, ed.
* **na (Demographic):** Connected to hi, en, ma.
* **ra (Familial):** Connected to oc, ch, sa, ed, ag.
* **ch (Familial):** Connected to ra, oc, se, en.
* **fa (Familial):** Connected to en, we, ho, ag.
* **ag (Familial):** Connected to ra, fa, ho.
* **in (Protected):** Connected to ci, oc, se.
* **se (Protected):** Connected to in, ch, ci, ed, en.
* **we (Protected):** Connected to fa, en, ma, ho.
* **ho (Protected):** Connected to we, fa, ag.
* **oc (Educational):** Connected to ra, in, ch, ed.
* **ed (Educational):** Connected to oc, ci, hi, se.
* **sa (Occupational):** Connected to ra, en.
* **en (Response):** Connected to se, ch, fa, we, sa, na, ma.
* **ma (Response):** Connected to na, we, en.
The line styles appear to indicate relationship strength or type:
* **Solid Lines:** Represent the most frequent and potentially strongest connections.
* **Dashed Lines:** Represent less frequent or weaker connections.
* **Dotted Lines:** Represent the least frequent or weakest connections.
### Key Observations
* **en (Response)** is a highly connected node, linked to nodes from all categories except demographic. This suggests it acts as a central hub in the network.
* **se (Protected)** and **ch (Familial)** are also highly connected, indicating significant roles within the network.
* **sa (Occupational)** has the fewest connections, suggesting a more isolated role.
* The demographic nodes (ci, hi, na) are relatively less connected compared to other categories.
* The familial nodes (ra, ch, fa, ag) are well-connected within their group and to other categories.
### Interpretation
This network diagram likely represents a social network or a system of relationships between individuals or entities. The color coding allows for analysis of connections based on different attributes (demographics, family ties, protection status, education, occupation, and responses).
The central role of the "en" node suggests it represents a key factor influencing the network, potentially a central decision-maker or a common resource. The strong connections within the familial and protected groups indicate the importance of these relationships within the network. The relative isolation of the occupational node suggests a specialized role with limited interaction with other parts of the network.
The varying line styles suggest that relationships are not all equal in strength or importance. Further analysis could involve quantifying the number of connections for each node to determine its centrality within the network and analyzing the types of relationships represented by the different line styles. The diagram provides a visual representation of complex relationships, allowing for identification of key players, influential groups, and potential vulnerabilities within the network.