## Network Diagram: Directed Graph of Categorical Nodes
### Overview
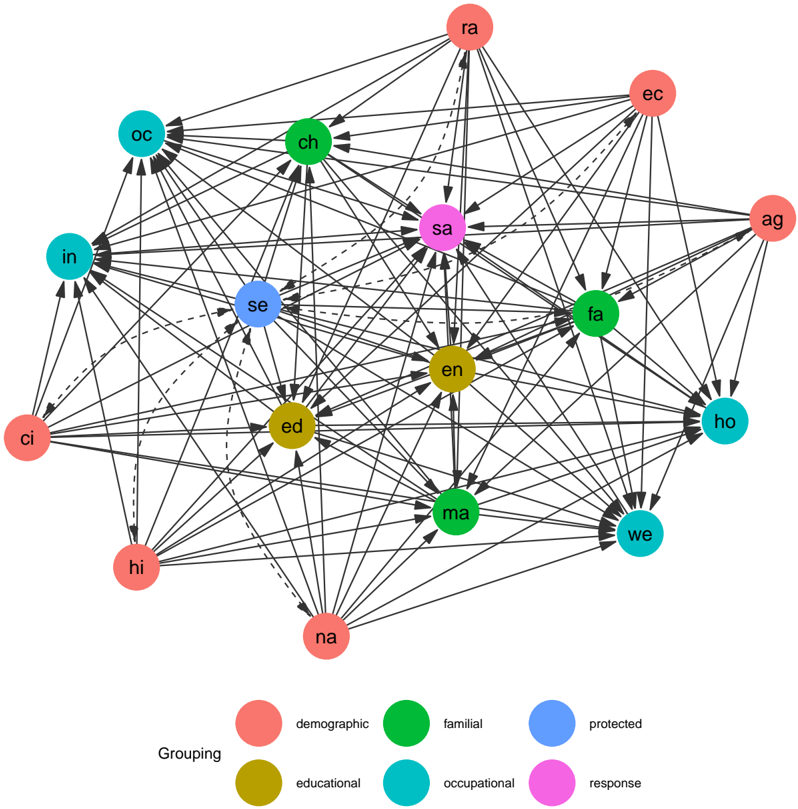
The image displays a complex directed network graph (a sociogram or influence diagram) consisting of 18 circular nodes connected by numerous directed edges (arrows). Each node is labeled with a two-letter code and color-coded according to a categorical grouping defined in a legend at the bottom. The graph illustrates a dense web of relationships or influences between entities from different categories.
### Components/Axes
* **Nodes:** 18 circular nodes, each with a unique two-letter label. The nodes are color-coded into six categories.
* **Edges:** Directed arrows connecting nodes. Most edges are solid black lines with arrowheads. A subset of edges are represented by dashed black lines.
* **Legend:** Located at the bottom center of the image. It defines the color-coding scheme under the title "Grouping".
* **Salmon/Pink:** `demographic`
* **Green:** `familial`
* **Blue:** `protected`
* **Olive/Yellow-Green:** `educational`
* **Cyan/Turquoise:** `occupational`
* **Magenta/Pink-Purple:** `response`
### Detailed Analysis
**Node Inventory (Grouped by Category):**
* **Demographic (Salmon):**
* `ra` (top center)
* `ec` (top right)
* `ag` (far right)
* `ci` (far left)
* `hi` (bottom left)
* `na` (bottom center)
* **Familial (Green):**
* `ch` (upper left-center)
* `fa` (right-center)
* `ma` (lower center)
* **Protected (Blue):**
* `se` (left-center)
* **Educational (Olive):**
* `ed` (center-left)
* `en` (center)
* **Occupational (Cyan):**
* `oc` (upper left)
* `in` (left)
* `ho` (right)
* `we` (bottom right)
* **Response (Magenta):**
* `sa` (upper center-right)
**Spatial Layout & Connectivity:**
* The graph has a rough core-periphery structure. Nodes `en` (educational), `sa` (response), `se` (protected), and `fa` (familial) are positioned centrally and exhibit very high connectivity, acting as major hubs.
* Demographic nodes (`ra`, `ec`, `ag`, `ci`, `hi`, `na`) are generally positioned around the periphery of the network.
* Occupational nodes (`oc`, `in`, `ho`, `we`) are also positioned towards the edges (left and right sides).
* **Edge Density:** The network is highly interconnected. Most nodes have multiple incoming and outgoing edges. The central hubs (`en`, `sa`, `se`) are particularly dense with connections.
* **Edge Types:** The majority of connections are solid lines. Dashed lines are present but less frequent (e.g., from `hi` to `se`, from `na` to `se`, from `ci` to `ed`). The diagram does not provide a key to differentiate the meaning of solid vs. dashed edges.
### Key Observations
1. **Central Hubs:** The nodes `en` (educational) and `sa` (response) appear to be the most connected nodes in the entire network, with arrows pointing to and from a vast number of other nodes across all categories.
2. **Category Clusters:** While connections cross categories extensively, some intra-category links are visible. For example, several demographic nodes connect to each other (e.g., `ra` to `ec`, `hi` to `na`).
3. **Peripheral Nodes:** Nodes like `ag` (demographic) and `ho` (occupational) have fewer connections compared to the central hubs, primarily sending or receiving links from a select few nodes.
4. **Directionality:** The arrows indicate a directed relationship. For instance, there is a clear flow from many demographic nodes (`ra`, `ec`, `ag`) towards the central `sa` (response) node. Conversely, `en` (educational) sends out a large number of edges to nodes in other categories.
### Interpretation
This diagram likely models a system of influences or dependencies between different life domains or variables. The categories suggest a socio-behavioral or public health context:
* **Demographic** factors (age, ethnicity, etc.) may influence or be influenced by other domains.
* **Familial** and **Educational** environments appear as key mediating or foundational structures.
* **Occupational** status is interconnected with these other life aspects.
* The single **Protected** node (`se`) and **Response** node (`sa`) are central, suggesting they might represent key outcome variables (e.g., a specific health/social response) and a protected characteristic or status (e.g., socioeconomic status, security) that are deeply embedded in the network.
The high density of connections, especially around `en` and `sa`, implies a complex system where changes in one factor could ripple through many others. The directed edges suggest hypothesized causal pathways or strong associations. The dashed lines might represent weaker, tentative, or secondary relationships compared to the solid lines. Without a specific title or context, the exact meaning of the two-letter codes is ambiguous, but the structure clearly communicates a multifaceted, interconnected model where educational and response factors are pivotal.