## Network Diagram: Relationships Between Categorized Entities
### Overview
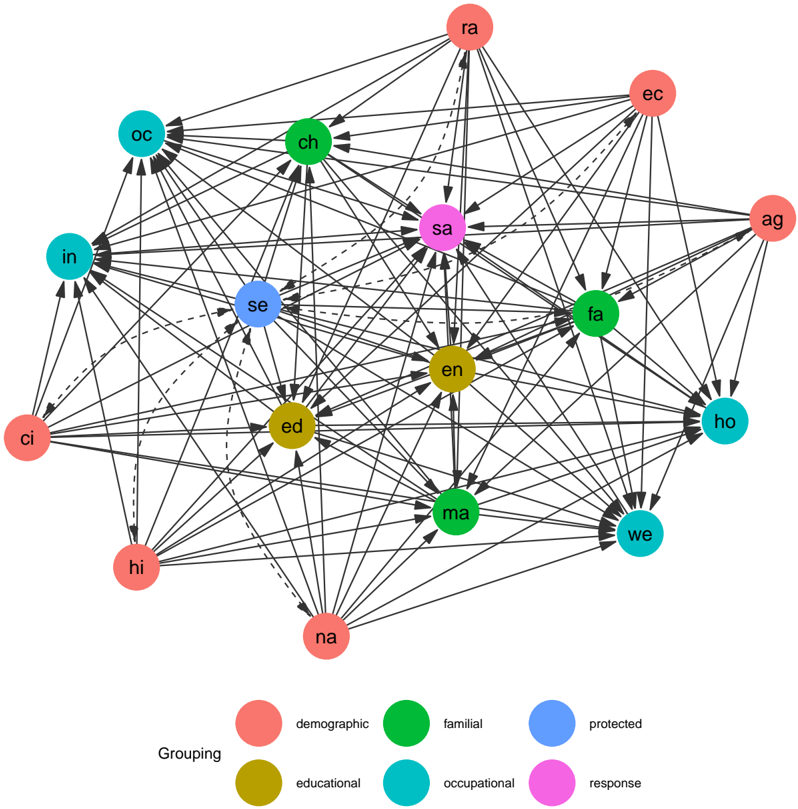
The image depicts a network diagram illustrating connections between 16 labeled nodes, each representing a distinct entity. Nodes are color-coded according to six categories (demographic, familial, protected, occupational, educational, response), with directional edges (arrows) indicating relationships. The diagram emphasizes interconnectedness, with dense clustering in certain regions and sparse connections in others.
### Components/Axes
- **Legend**: Located at the bottom center, mapping colors to categories:
- Red: Demographic
- Green: Familial
- Blue: Protected
- Teal: Occupational
- Yellow: Educational
- Purple: Response
- **Nodes**: 16 labeled entities (e.g., "ra," "ec," "ag") positioned across the diagram. Colors align with the legend.
- **Edges**: Black lines with arrows (directional) and some dashed lines (uncertain significance).
### Detailed Analysis
#### Node Labels and Colors
1. **Demographic (Red)**:
- `ra`, `ec`, `ag`, `ci`, `hi`, `na` (6 nodes).
- Positioned at the top (`ra`, `ec`), right (`ag`), left (`ci`, `hi`), and bottom (`na`).
2. **Familial (Green)**:
- `ch`, `fa`, `ma` (3 nodes).
- Central (`ch`, `fa`), middle (`ma`).
3. **Protected (Blue)**:
- `se` (1 node).
- Central-left.
4. **Occupational (Teal)**:
- `oc`, `in`, `ho`, `we` (4 nodes).
- Top-left (`oc`, `in`), bottom-right (`ho`, `we`).
5. **Educational (Yellow)**:
- `en`, `ed` (2 nodes).
- Lower-center (`en`, `ed`).
6. **Response (Purple)**:
- `sa` (1 node).
- Central.
#### Edge Characteristics
- **Directional Arrows**: Most edges have solid black arrows indicating flow (e.g., `ra` → `ec`, `ch` → `sa`).
- **Dashed Lines**: A few edges (e.g., `se` → `ed`) use dashed lines, possibly denoting weaker or indirect relationships (uncertain without explicit legend clarification).
### Key Observations
1. **Central Hub**: The "response" node (`sa`, purple) acts as a central connector, linking to 8+ nodes (e.g., `ra`, `ec`, `ch`, `fa`, `en`, `ed`).
2. **Demographic Cluster**: Red nodes (`ra`, `ec`, `ag`, `ci`, `hi`, `na`) form a dense subnetwork, suggesting strong interconnections within this category.
3. **Educational-Occupational Links**: Yellow (`en`, `ed`) and teal (`oc`, `in`, `ho`, `we`) nodes are interconnected, implying relationships between education and occupational sectors.
4. **Protected Node Isolation**: The blue node (`se`) has fewer connections, primarily linking to educational (`ed`) and familial (`ch`) nodes.
5. **Dashed Edges**: Uncertainty exists around the meaning of dashed lines (e.g., `se` → `ed`), which may represent indirect or secondary relationships.
### Interpretation
The diagram likely models a system where entities (nodes) interact across categories (e.g., demographic, familial). The central "response" node (`sa`) may represent a mediator or hub for cross-category communication. The dense demographic cluster (`ra`, `ec`, `ag`, etc.) suggests these entities are highly interdependent, possibly reflecting societal or structural relationships. Educational (`en`, `ed`) and occupational (`oc`, `in`, `ho`, `we`) nodes show moderate connectivity, indicating potential pathways for resource or information flow between these sectors. The isolated "protected" node (`se`) might represent a specialized or niche category with limited interactions. Dashed edges warrant further investigation to clarify their role in the network.