## Scatter Plot: Risk or Safety
### Overview
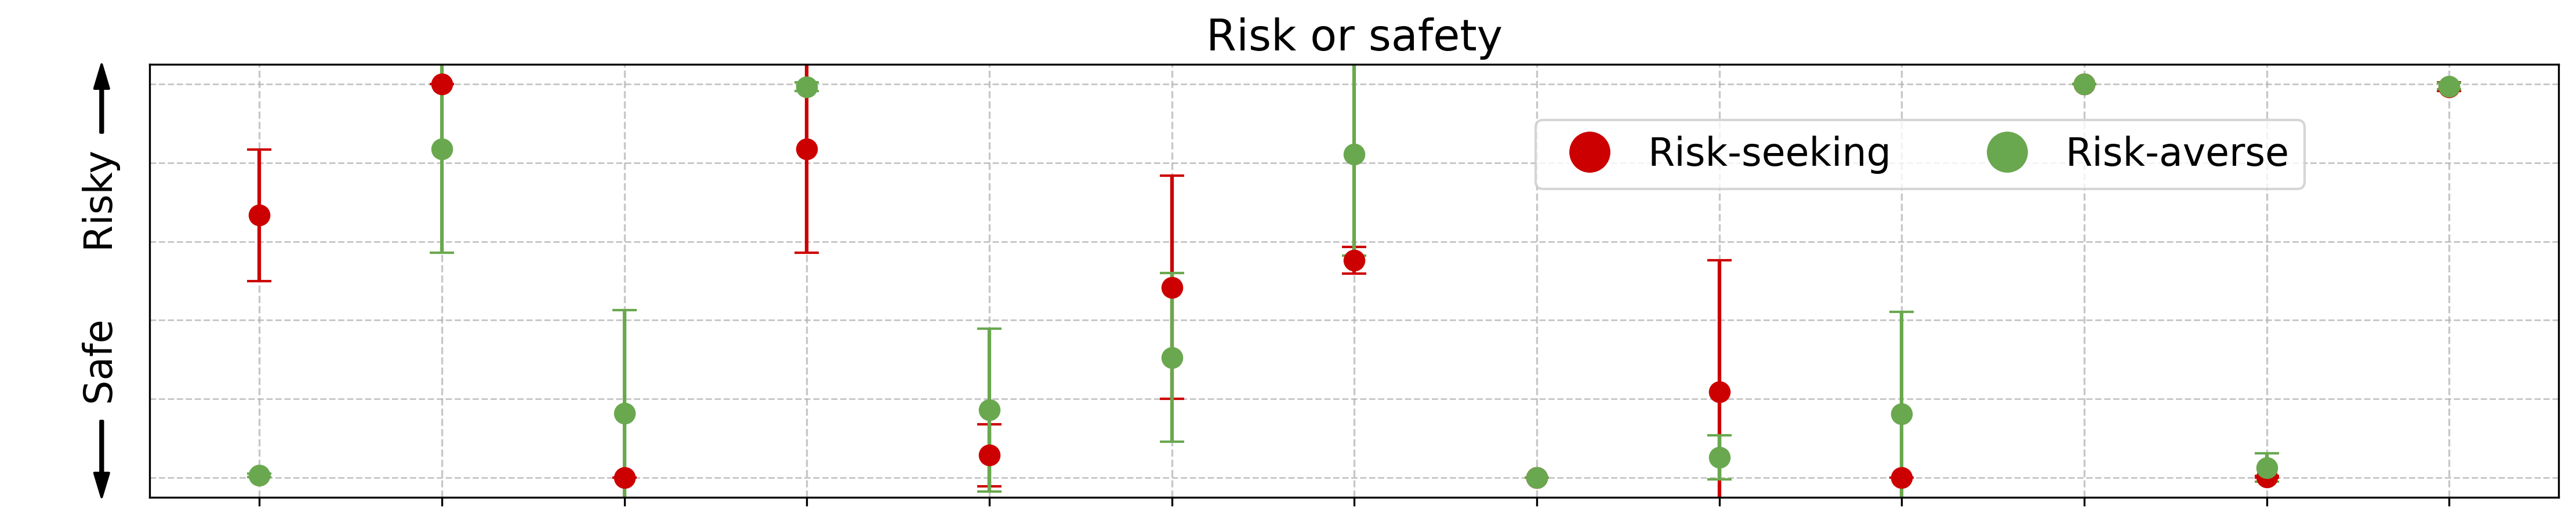
The image is a scatter plot comparing risk-seeking and risk-averse behaviors across an unspecified number of categories. The y-axis represents a spectrum from "Safe" to "Risky," and each category has two data points: one for risk-seeking (red) and one for risk-averse (green). Error bars are present for each data point, indicating variability or uncertainty.
### Components/Axes
* **Title:** Risk or safety
* **Y-axis:**
* Label: Risky (top)
* Label: Safe (bottom)
* Direction: Arrow pointing downwards, indicating the direction of increasing safety.
* **X-axis:** No explicit label, but represents different categories or scenarios.
* **Grid:** Dashed grid lines for visual aid.
* **Legend:** Located in the top-right corner.
* Risk-seeking (red circle)
* Risk-averse (green circle)
### Detailed Analysis
The plot consists of pairs of red (risk-seeking) and green (risk-averse) data points along the x-axis. Each pair represents a different category. The vertical position of each point indicates the perceived risk level, and the error bars show the range of possible values.
Here's a breakdown of the data points, moving from left to right:
1. **Category 1:**
* Risk-seeking (red): Approximately 0.75 on the "Risky" scale, with error bars extending from approximately 0.6 to 0.9.
* Risk-averse (green): Approximately 0.1 on the "Risky" scale, with error bars extending from approximately 0 to 0.2.
2. **Category 2:**
* Risk-seeking (red): Approximately 0.95 on the "Risky" scale, with no visible error bars.
* Risk-averse (green): Approximately 0.7 on the "Risky" scale, with error bars extending from approximately 0.5 to 0.9.
3. **Category 3:**
* Risk-seeking (red): Approximately 0.1 on the "Risky" scale, with no visible error bars.
* Risk-averse (green): Approximately 0.2 on the "Risky" scale, with error bars extending from approximately 0.1 to 0.3.
4. **Category 4:**
* Risk-seeking (red): Approximately 0.8 on the "Risky" scale, with error bars extending from approximately 0.5 to 1.0.
* Risk-averse (green): Approximately 0.85 on the "Risky" scale, with error bars extending from approximately 0.7 to 1.0.
5. **Category 5:**
* Risk-seeking (red): Approximately 0.3 on the "Risky" scale, with error bars extending from approximately 0.1 to 0.5.
* Risk-averse (green): Approximately 0.2 on the "Risky" scale, with error bars extending from approximately 0.1 to 0.3.
6. **Category 6:**
* Risk-seeking (red): Approximately 0.4 on the "Risky" scale, with error bars extending from approximately 0.2 to 0.6.
* Risk-averse (green): Approximately 0.5 on the "Risky" scale, with error bars extending from approximately 0.3 to 0.7.
7. **Category 7:**
* Risk-seeking (red): Approximately 0.05 on the "Risky" scale, with no visible error bars.
* Risk-averse (green): Approximately 0.75 on the "Risky" scale, with error bars extending from approximately 0.6 to 0.9.
8. **Category 8:**
* Risk-seeking (red): Approximately 0.2 on the "Risky" scale, with error bars extending from approximately 0.1 to 0.4.
* Risk-averse (green): Approximately 0.15 on the "Risky" scale, with error bars extending from approximately 0 to 0.3.
9. **Category 9:**
* Risk-seeking (red): Approximately 0.05 on the "Risky" scale, with no visible error bars.
* Risk-averse (green): Approximately 0.95 on the "Risky" scale, with no visible error bars.
10. **Category 10:**
* Risk-seeking (red): Approximately 0.1 on the "Risky" scale, with no visible error bars.
* Risk-averse (green): Approximately 0.95 on the "Risky" scale, with no visible error bars.
### Key Observations
* In most categories, risk-seeking behavior is perceived as riskier than risk-averse behavior.
* The error bars vary in size, suggesting different levels of agreement or certainty about the risk levels.
* In some categories, the error bars overlap, indicating that the perceived risk levels for risk-seeking and risk-averse behaviors are not significantly different.
### Interpretation
The scatter plot visualizes the perceived risk associated with risk-seeking and risk-averse behaviors across different categories. The data suggests that, in general, risk-seeking is seen as riskier. However, the variability in error bars and the instances of overlapping error bars indicate that this perception is not uniform across all categories. The specific categories are not labeled, so it's impossible to draw conclusions about which scenarios are perceived as particularly risky or safe for either behavior. The plot highlights the subjective nature of risk perception and the importance of considering context when evaluating risk-taking behaviors.