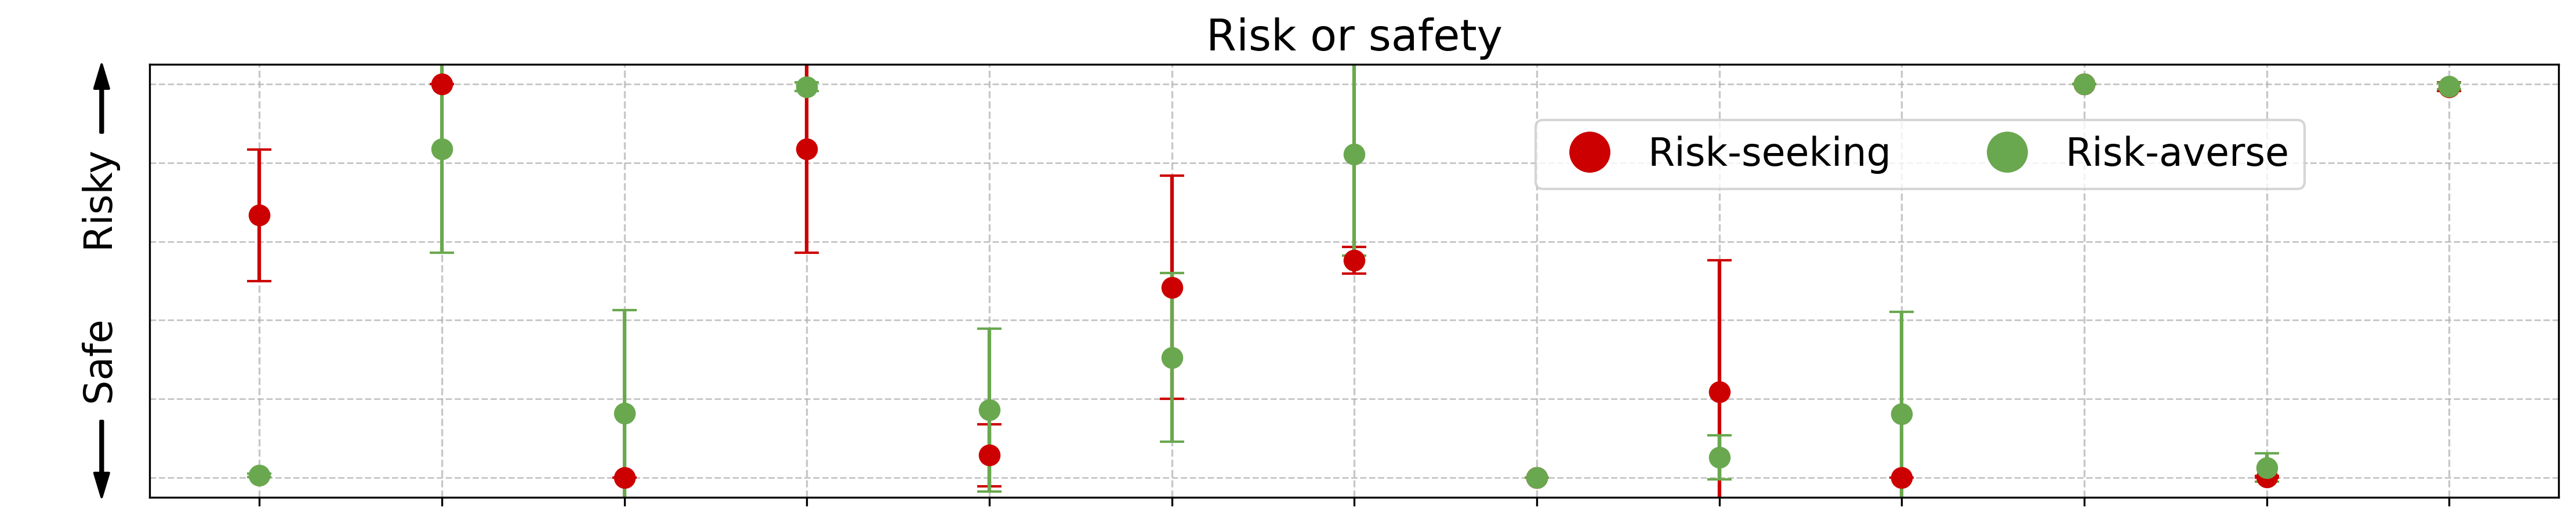
## Scatter Plot: Risk or Safety
### Overview
The image is a scatter plot comparing "Risk-seeking" (red dots) and "Risk-averse" (green dots) behaviors across a spectrum of risk preferences. The vertical axis ranges from "Risky" (top) to "Safe" (bottom), while the horizontal axis is labeled "Risk or safety." Error bars are present for all data points, with vertical bars for Risk-seeking and horizontal bars for Risk-averse.
### Components/Axes
- **Title**: "Risk or safety" (centered at the top).
- **Vertical Axis**: Labeled "Risky" (top) to "Safe" (bottom), with no explicit numerical scale.
- **Horizontal Axis**: Labeled "Risk or safety," with categories implied by the legend (Risk-seeking and Risk-averse).
- **Legend**: Located in the top-right corner, with:
- **Red circles**: Risk-seeking.
- **Green circles**: Risk-averse.
- **Error Bars**:
- Vertical for Risk-seeking (red).
- Horizontal for Risk-averse (green).
### Detailed Analysis
- **Risk-seeking (Red Dots)**:
- Positioned predominantly on the **left side** of the horizontal axis (lower "Risk or safety" values).
- Clustered **lower** on the vertical axis (closer to "Safe").
- Error bars vary in length, with some extending significantly upward (e.g., one point near the top of the vertical axis).
- **Risk-averse (Green Dots)**:
- Positioned predominantly on the **right side** of the horizontal axis (higher "Risk or safety" values).
- Clustered **higher** on the vertical axis (closer to "Risky").
- Error bars vary in length, with some extending significantly downward (e.g., one point near the bottom of the vertical axis).
### Key Observations
1. **Inverse Relationship**: Risk-seeking individuals (red) generally prefer lower-risk options, while Risk-averse individuals (green) prefer higher-risk options.
2. **Error Bar Variability**:
- Risk-seeking error bars show greater vertical spread (uncertainty in risk preference).
- Risk-averse error bars show greater horizontal spread (uncertainty in risk tolerance).
3. **Outliers**:
- One Risk-seeking point (red) near the top of the vertical axis (riskier preference).
- One Risk-averse point (green) near the bottom of the vertical axis (safer preference).
### Interpretation
The data suggests a paradoxical trend: individuals labeled "Risk-seeking" tend to avoid high-risk scenarios, while "Risk-averse" individuals gravitate toward them. This could indicate that:
- **Risk-seeking** behavior is context-dependent, with participants avoiding extreme risks despite the label.
- **Risk-averse** individuals may have a higher tolerance for risk in specific domains (e.g., financial decisions vs. physical risks).
- The error bars highlight significant variability in preferences within each group, suggesting overlapping behaviors or measurement noise.
The plot challenges intuitive expectations, implying that risk preferences may not align with self-identified labels. Further analysis of the underlying data (e.g., survey questions, experimental conditions) would clarify these contradictions.