## Donut Chart: KGOT Runtime Distribution
### Overview
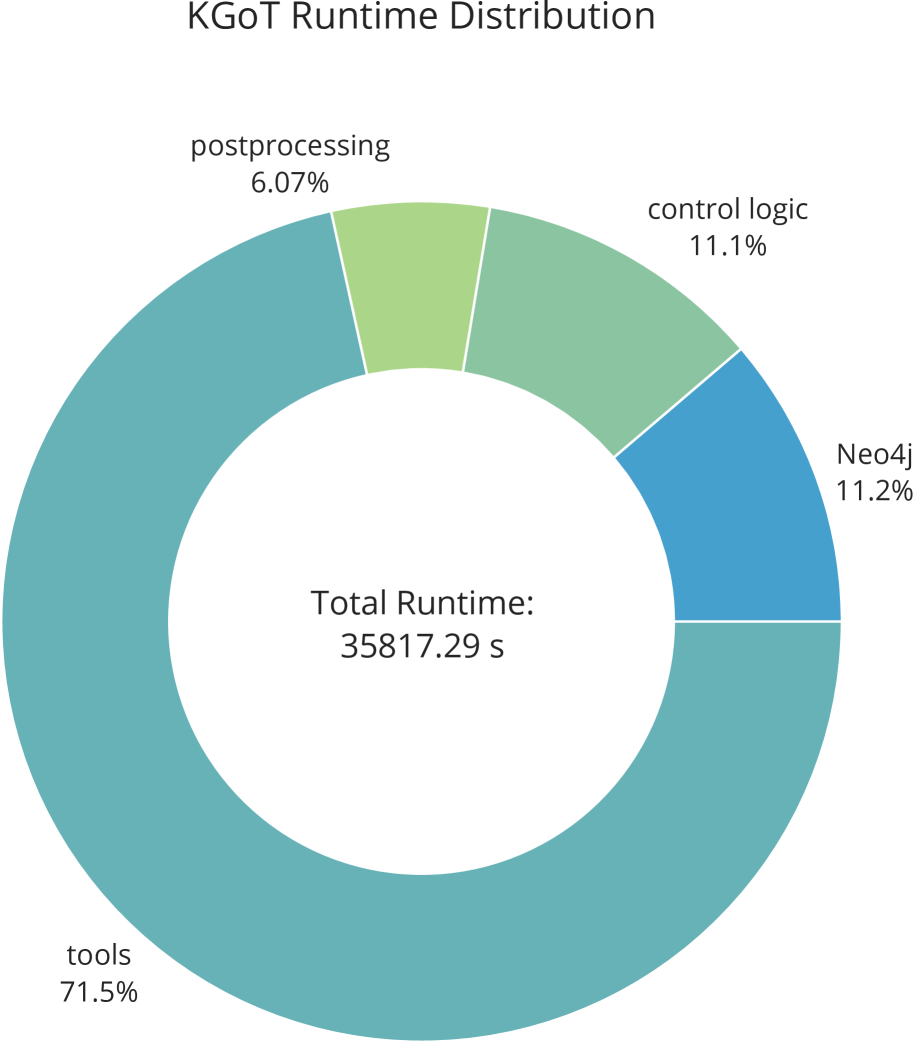
The image is a donut chart illustrating the runtime distribution of KGOT, broken down into four categories: tools, Neo4j, control logic, and postprocessing. The chart also displays the total runtime.
### Components/Axes
* **Title:** KGOT Runtime Distribution
* **Categories:**
* tools
* Neo4j
* control logic
* postprocessing
* **Values:** Represented as percentages of the total runtime.
* **Total Runtime:** 35817.29 s
### Detailed Analysis
* **tools:** 71.5% (teal color) - Occupies the largest portion of the donut chart.
* **Neo4j:** 11.2% (blue color) - Located on the right side of the chart.
* **control logic:** 11.1% (light green color) - Positioned at the top-right of the chart.
* **postprocessing:** 6.07% (light green color) - Located at the top-left of the chart.
* **Total Runtime:** 35817.29 s - Displayed in the center of the donut chart.
### Key Observations
* The "tools" category accounts for the vast majority (71.5%) of the total runtime.
* "Neo4j" and "control logic" have similar runtime percentages (11.2% and 11.1% respectively).
* "postprocessing" has the smallest runtime percentage (6.07%).
### Interpretation
The donut chart provides a clear visualization of the runtime distribution for KGOT. The dominance of the "tools" category suggests that the majority of the processing time is spent on tasks related to tools. The relatively small percentage for "postprocessing" indicates that this stage is less time-consuming compared to the other categories. The total runtime of 35817.29 seconds provides a benchmark for evaluating the overall performance of KGOT.