## Pie Chart: KGoT Runtime Distribution
### Overview
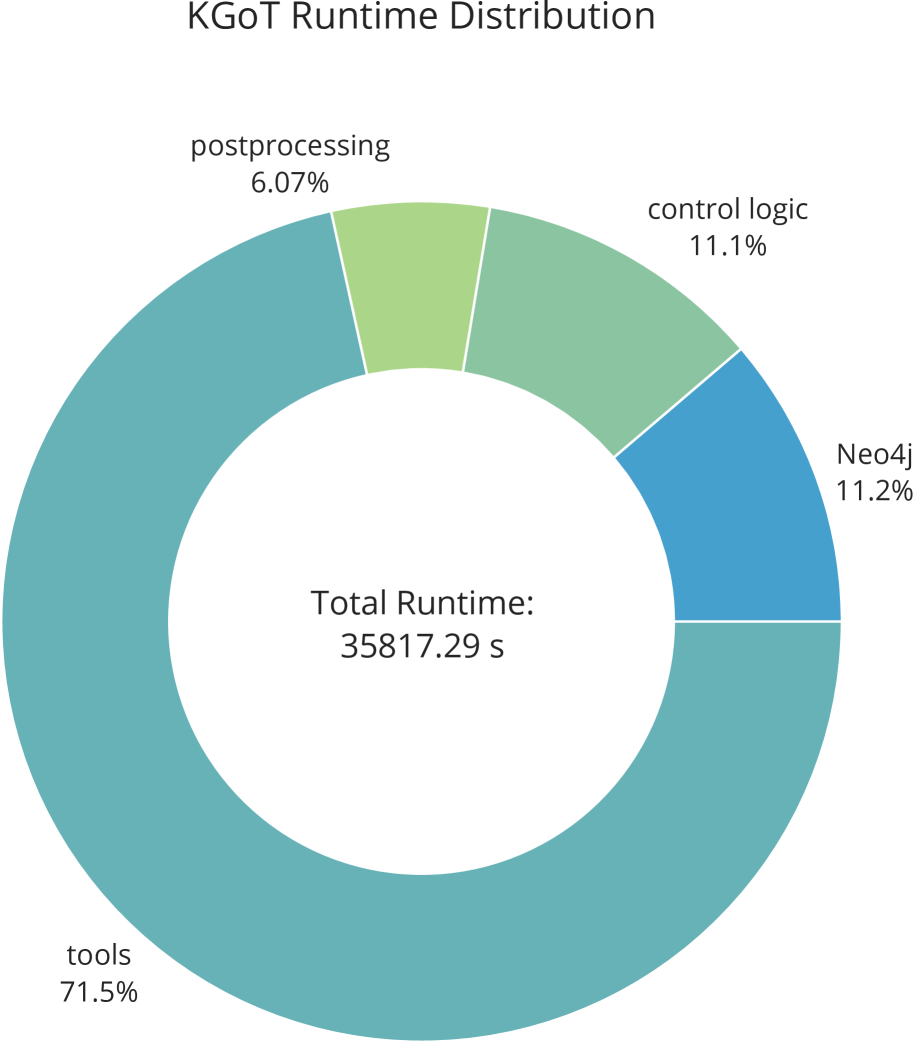
A circular pie chart visualizing the distribution of runtime across four categories: "tools," "Neo4j," "control logic," and "postprocessing." The total runtime is explicitly labeled as **35817.29 seconds**. Each slice is color-coded and labeled with its percentage contribution.
### Components/Axes
- **Title**: "KGoT Runtime Distribution" (top-center).
- **Total Runtime**: Centered text: "Total Runtime: 35817.29 s".
- **Legend**: Integrated into the chart via color-coded slices with labels and percentages.
- **Slices**:
- **tools**: Teal (#008080), 71.5%.
- **Neo4j**: Blue (#0000FF), 11.2%.
- **control logic**: Green (#00FF00), 11.1%.
- **postprocessing**: Light green (#90EE90), 6.07%.
### Detailed Analysis
- **tools**: Dominates the chart, occupying the largest slice (71.5%). Positioned at the bottom-left quadrant.
- **Neo4j**: Second-largest slice (11.2%), located in the upper-right quadrant.
- **control logic**: Third-largest slice (11.1%), adjacent to Neo4j in the upper-right quadrant.
- **postprocessing**: Smallest slice (6.07%), positioned at the top-right quadrant.
### Key Observations
1. **tools** accounts for **~71.5%** of the total runtime, far exceeding other categories.
2. **Neo4j** and **control logic** have nearly identical contributions (~11.1–11.2%).
3. **postprocessing** is the smallest contributor at **6.07%**.
4. Percentages sum to 100% (71.5 + 11.2 + 11.1 + 6.07 = 99.87% due to rounding).
### Interpretation
The chart highlights that **tools** consume the majority of runtime, suggesting they are the most resource-intensive component. The near-equal contributions of **Neo4j** and **control logic** indicate balanced but secondary workloads. **Postprocessing** is the least significant. This distribution could imply optimization opportunities for the "tools" category, which may be a bottleneck. The slight rounding discrepancy in percentages (99.87% vs. 100%) is negligible and likely due to decimal truncation.