## Bar Chart: Latency vs. Batch Size for FP16 and INT8 Precision
### Overview
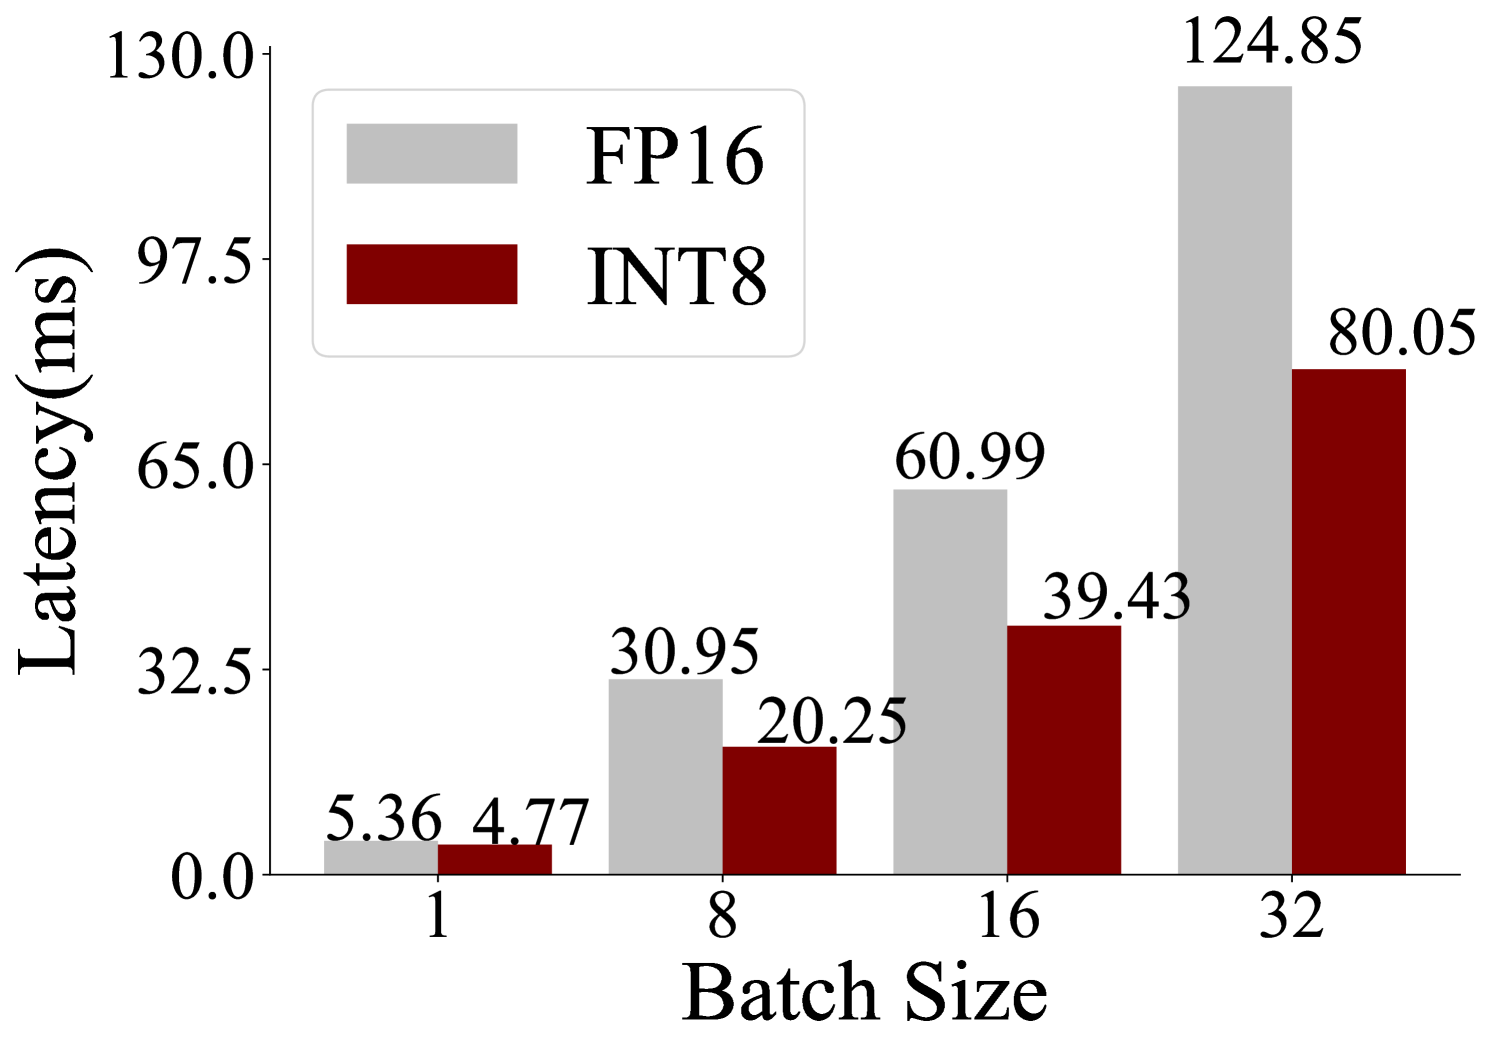
The image is a grouped bar chart comparing the inference latency (in milliseconds) of two numerical precision formats, FP16 (16-bit floating point) and INT8 (8-bit integer), across four different batch sizes. The chart demonstrates how latency scales with increasing batch size for each precision type.
### Components/Axes
* **Chart Type:** Grouped vertical bar chart.
* **X-Axis:** Labeled **"Batch Size"**. It has four discrete categories: **1, 8, 16, and 32**.
* **Y-Axis:** Labeled **"Latency(ms)"**. The scale is linear, ranging from **0.0 to 130.0**, with major tick marks at intervals of 32.5 (0.0, 32.5, 65.0, 97.5, 130.0).
* **Legend:** Positioned in the **top-left corner** of the chart area. It contains two entries:
* A light gray rectangle labeled **"FP16"**.
* A dark red (maroon) rectangle labeled **"INT8"**.
* **Data Series:** Two series of bars, grouped by batch size.
* **FP16 Series:** Represented by light gray bars.
* **INT8 Series:** Represented by dark red bars.
### Detailed Analysis
The precise latency values are annotated directly above each bar.
| Batch Size | FP16 Latency (ms) | INT8 Latency (ms) |
| :--- | :--- | :--- |
| **1** | 5.36 | 4.77 |
| **8** | 30.95 | 20.25 |
| **16** | 60.99 | 39.43 |
| **32** | 124.85 | 80.05 |
**Trend Verification:**
* **FP16 Trend (Gray Bars):** The latency shows a strong, near-linear upward trend as batch size increases. The slope is steep, indicating significant latency cost for larger batches.
* **INT8 Trend (Red Bars):** The latency also increases with batch size, but the slope is noticeably less steep than that of FP16. The growth appears more controlled.
### Key Observations
1. **Consistent Performance Advantage:** For every batch size shown, INT8 (dark red) exhibits lower latency than FP16 (light gray).
2. **Diverging Performance Gap:** The absolute difference in latency between FP16 and INT8 grows substantially as the batch size increases.
* At Batch Size 1: Difference = 0.59 ms (FP16 is ~12% slower).
* At Batch Size 32: Difference = 44.80 ms (FP16 is ~56% slower).
3. **Scaling Behavior:** Both precision formats show increased latency with larger batch sizes, which is expected due to increased computational load. However, INT8 demonstrates superior scalability.
### Interpretation
This chart provides a clear performance comparison relevant to machine learning model inference optimization. The data suggests that using INT8 quantization offers a significant latency benefit over FP16, and this advantage becomes dramatically more pronounced at larger batch sizes.
The underlying reason is likely that INT8 operations are more computationally efficient (requiring less memory bandwidth and enabling more parallel operations) on the target hardware. The widening gap indicates that the efficiency gains of INT8 are not just a fixed offset but compound as the workload scales. For a system designer, this implies that choosing INT8 over FP16 is particularly crucial for high-throughput scenarios where large batch sizes are used to maximize hardware utilization. The chart makes a strong case for quantization as a key technique for reducing inference latency, especially under heavy load.