## Bar Chart: Latency Comparison Between FP16 and INT8 Across Batch Sizes
### Overview
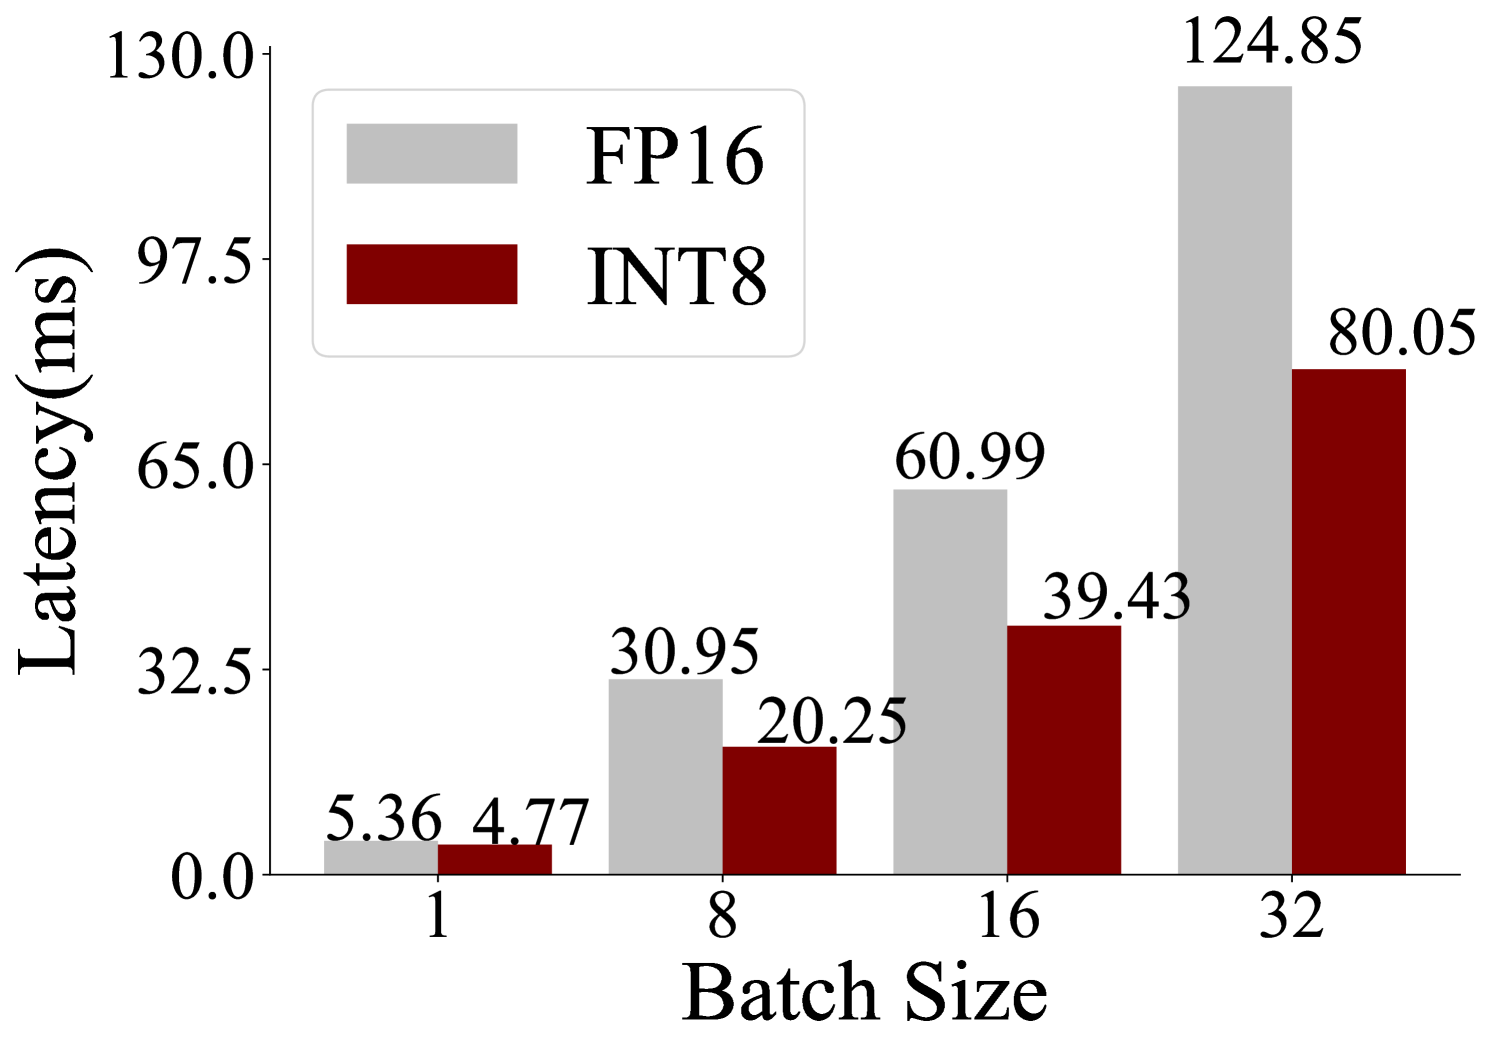
The chart compares latency (in milliseconds) for two computational methods, FP16 and INT8, across four batch sizes (1, 8, 16, 32). Latency values are displayed as grouped bars, with FP16 in gray and INT8 in red. The y-axis ranges from 0 to 130 ms, and the x-axis represents batch sizes.
### Components/Axes
- **X-axis (Batch Size)**: Labeled "Batch Size" with discrete ticks at 1, 8, 16, and 32.
- **Y-axis (Latency)**: Labeled "Latency (ms)" with a linear scale from 0 to 130 ms.
- **Legend**: Located in the top-left corner, with FP16 (gray) and INT8 (red) labeled.
- **Bar Values**: Numerical latency values are annotated on top of each bar.
### Detailed Analysis
- **Batch Size 1**:
- FP16: 5.36 ms (gray bar).
- INT8: 4.77 ms (red bar).
- **Batch Size 8**:
- FP16: 30.95 ms (gray bar).
- INT8: 20.25 ms (red bar).
- **Batch Size 16**:
- FP16: 60.99 ms (gray bar).
- INT8: 39.43 ms (red bar).
- **Batch Size 32**:
- FP16: 124.85 ms (gray bar).
- INT8: 80.05 ms (red bar).
### Key Observations
1. **FP16 vs. INT8 Latency**: FP16 consistently exhibits higher latency than INT8 across all batch sizes.
2. **Trend with Batch Size**: Both methods show increasing latency as batch size grows, but FP16’s latency grows more sharply.
3. **Efficiency Gap**: The latency difference between FP16 and INT8 widens significantly at larger batch sizes (e.g., 44.8 ms at batch 32).
### Interpretation
The data demonstrates that INT8 is more latency-efficient than FP16 for all tested batch sizes. The disparity in latency increases with larger batches, suggesting that INT8 scales better for high-throughput or resource-constrained environments. This could be critical for applications prioritizing speed, such as real-time processing or edge computing. FP16’s higher latency at larger batches may stem from its precision requirements, which demand more computational resources.