## Bar Chart: Memory and Throughput Comparison (FP32 vs. BF16)
### Overview
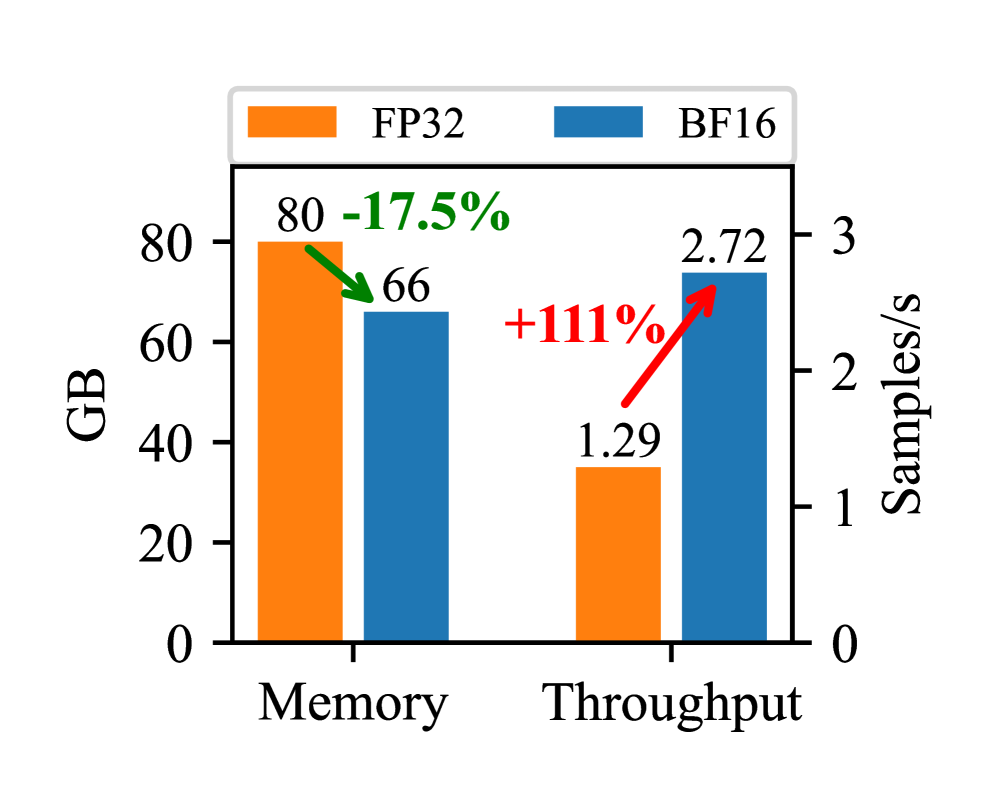
This is a dual-axis bar chart comparing two computational metrics—Memory usage and Throughput—between two data precision formats: FP32 (32-bit floating point) and BF16 (Brain Floating Point 16-bit). The chart visually demonstrates the trade-offs in memory consumption and processing speed when switching from FP32 to BF16.
### Components/Axes
* **Legend:** Located at the top center. It defines the two data series:
* **FP32:** Represented by orange bars.
* **BF16:** Represented by blue bars.
* **X-Axis (Categories):** Two primary categories are displayed along the bottom:
1. **Memory** (left group)
2. **Throughput** (right group)
* **Left Y-Axis (Primary):** Labeled **"GB"** (Gigabytes). It measures memory usage. The scale runs from 0 to 80, with major tick marks at 0, 20, 40, 60, and 80.
* **Right Y-Axis (Secondary):** Labeled **"Samples/s"** (Samples per second). It measures throughput. The scale runs from 0 to 3, with major tick marks at 0, 1, 2, and 3.
* **Data Annotations:** Each bar has its exact value printed above it. Additionally, percentage change arrows are drawn between the FP32 and BF16 bars within each category.
### Detailed Analysis
**1. Memory Category (Left Group):**
* **FP32 (Orange Bar):** Value is **80 GB**. This bar reaches the top of the left y-axis scale.
* **BF16 (Blue Bar):** Value is **66 GB**.
* **Trend & Change:** A green arrow points downward from the FP32 bar to the BF16 bar, labeled **"-17.5%"**. This indicates that using BF16 precision reduces memory consumption by approximately 17.5% compared to FP32.
**2. Throughput Category (Right Group):**
* **FP32 (Orange Bar):** Value is **1.29 Samples/s**.
* **BF16 (Blue Bar):** Value is **2.72 Samples/s**.
* **Trend & Change:** A red arrow points upward from the FP32 bar to the BF16 bar, labeled **"+111%"**. This indicates that using BF16 precision increases processing throughput by approximately 111% (more than doubles) compared to FP32.
### Key Observations
* **Inverse Relationship:** There is a clear inverse relationship between memory usage and throughput when switching from FP32 to BF16. Lower memory consumption (a 17.5% decrease) is accompanied by a significant increase in processing speed (a 111% increase).
* **Magnitude of Impact:** The performance gain in throughput (+111%) is proportionally much larger than the reduction in memory footprint (-17.5%).
* **Visual Emphasis:** The chart uses color-coded arrows (green for reduction, red for increase) and bold percentage labels to immediately highlight the direction and magnitude of the change for each metric.
### Interpretation
This chart effectively communicates a key advantage of using reduced-precision formats like BF16 in computational workloads, particularly in fields like machine learning and scientific computing.
* **What the data suggests:** The data demonstrates that BF16 offers a highly favorable trade-off. It significantly reduces the memory bandwidth and capacity requirements (saving 14 GB in this example) while simultaneously providing a substantial boost in computational throughput. This is because BF16 uses half the bits of FP32, allowing more data to be transferred and processed in parallel.
* **How elements relate:** The dual-axis design is crucial here. It allows the direct visual comparison of two different units (GB and Samples/s) on the same chart, making the correlated trade-off immediately apparent. The side-by-side bars within each category enable a direct comparison between the two formats for each specific metric.
* **Notable implications:** The primary implication is that adopting BF16 can lead to more efficient hardware utilization. Systems can either process the same workload faster or handle larger models/datasets within the same memory constraints. The chart serves as a technical justification for using BF16, showing it is not merely a compromise but an optimization that improves both key performance indicators. The specific values (80 GB, 66 GB, 1.29, 2.72) provide concrete evidence for this optimization in the measured scenario.