## Line Chart: Nesting Depth vs. Number of Failed LLMs
### Overview
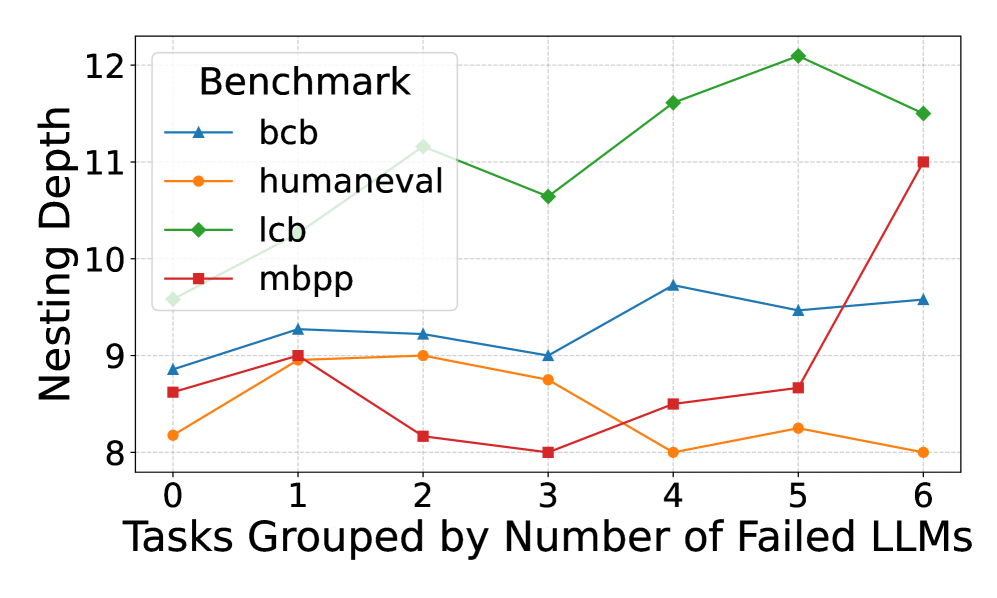
The image is a line chart comparing the nesting depth of four benchmarks (bcb, humaneval, lcb, and mbpp) against the number of failed Large Language Models (LLMs). The x-axis represents the number of failed LLMs, ranging from 0 to 6. The y-axis represents the nesting depth, ranging from 8 to 12. Each benchmark is represented by a different colored line with a distinct marker.
### Components/Axes
* **Title:** Benchmark (Legend Title)
* **X-axis Title:** Tasks Grouped by Number of Failed LLMs
* **X-axis Markers:** 0, 1, 2, 3, 4, 5, 6
* **Y-axis Title:** Nesting Depth
* **Y-axis Markers:** 8, 9, 10, 11, 12
* **Legend:** Located in the top-left corner of the chart.
* **bcb:** Blue line with triangle markers.
* **humaneval:** Orange line with circle markers.
* **lcb:** Green line with diamond markers.
* **mbpp:** Red line with square markers.
### Detailed Analysis
* **bcb (Blue, Triangle):**
* Trend: Generally stable with slight fluctuations.
* Data Points: (0, 8.8), (1, 9.3), (2, 9.2), (3, 9.0), (4, 9.7), (5, 9.5), (6, 9.6)
* **humaneval (Orange, Circle):**
* Trend: Decreasing trend overall.
* Data Points: (0, 8.2), (1, 9.0), (2, 8.9), (3, 8.7), (4, 8.0), (5, 8.2), (6, 8.0)
* **lcb (Green, Diamond):**
* Trend: Increasing trend overall.
* Data Points: (0, 8.7), (1, 8.9), (2, 8.1), (3, 10.7), (4, 11.4), (5, 12.1), (6, 11.5)
* **mbpp (Red, Square):**
* Trend: Increasing trend overall, with a sharp increase at the end.
* Data Points: (0, 8.6), (1, 8.9), (2, 8.1), (3, 8.0), (4, 8.5), (5, 8.6), (6, 11.0)
### Key Observations
* The lcb benchmark shows the highest nesting depth overall and a clear increasing trend as the number of failed LLMs increases.
* The humaneval benchmark shows a decreasing trend in nesting depth as the number of failed LLMs increases.
* The mbpp benchmark shows a significant increase in nesting depth when the number of failed LLMs is 6.
* The bcb benchmark remains relatively stable across different numbers of failed LLMs.
### Interpretation
The chart suggests that the nesting depth of different benchmarks responds differently to the failure of LLMs. The lcb benchmark's increasing nesting depth with more failed LLMs could indicate that it becomes more complex to solve as the LLMs struggle. Conversely, the humaneval benchmark's decreasing nesting depth might suggest that it becomes simpler or less demanding when LLMs fail. The mbpp benchmark's sharp increase at 6 failed LLMs could indicate a threshold effect where the task complexity suddenly increases when a certain number of LLMs fail. The bcb benchmark's stability suggests that its complexity is less affected by the performance of the LLMs.