## Line Chart: Nesting Depth vs. Failed LLMs
### Overview
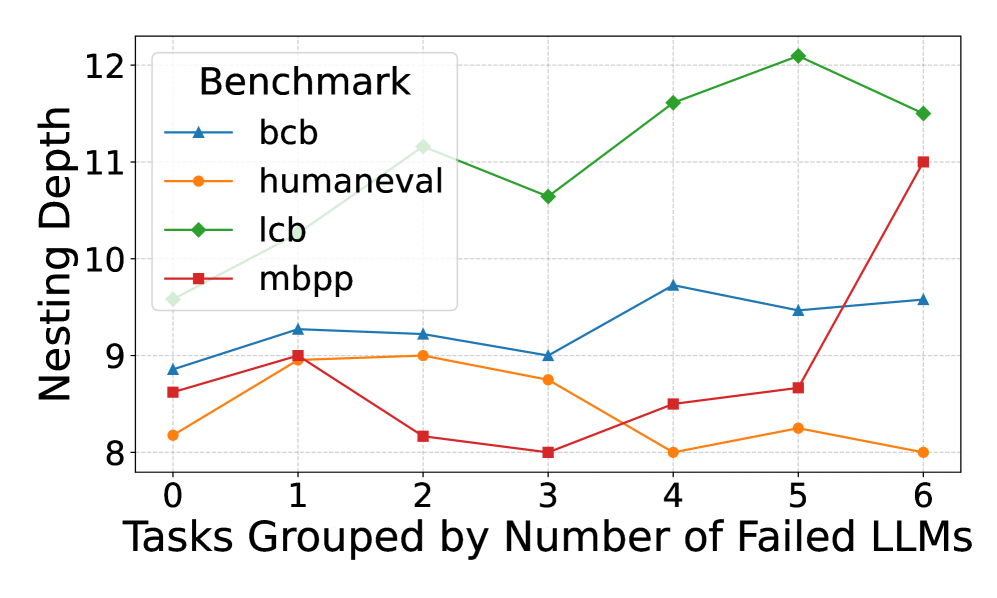
This line chart displays the relationship between the number of failed Large Language Models (LLMs) and the nesting depth achieved on various benchmarks. The x-axis represents the number of failed LLMs, grouped into categories from 0 to 6. The y-axis represents the nesting depth, ranging from approximately 8 to 12. Four different benchmarks are represented by distinct colored lines: bcb, humaneval, lcb, and mbpp.
### Components/Axes
* **X-axis Title:** "Tasks Grouped by Number of Failed LLMs"
* **X-axis Markers:** 0, 1, 2, 3, 4, 5, 6
* **Y-axis Title:** "Nesting Depth"
* **Y-axis Scale:** Approximately 8 to 12
* **Legend Title:** "Benchmark"
* **Legend Labels:**
* bcb (Blue Line)
* humaneval (Orange Line)
* lcb (Green Line)
* mbpp (Red Line)
### Detailed Analysis
* **bcb (Blue Line):** The line starts at approximately 9.1 at x=0, increases to a peak of around 9.6 at x=4, then decreases to approximately 9.3 at x=6. The trend is generally flat with a slight increase and then a slight decrease.
* (0, 9.1)
* (1, 9.2)
* (2, 9.2)
* (3, 9.4)
* (4, 9.6)
* (5, 9.4)
* (6, 9.3)
* **humaneval (Orange Line):** The line begins at approximately 8.6 at x=0, increases to a peak of around 9.3 at x=1, then decreases to approximately 8.2 at x=4, and rises again to around 8.5 at x=6. The trend is fluctuating.
* (0, 8.6)
* (1, 9.3)
* (2, 8.8)
* (3, 8.5)
* (4, 8.2)
* (5, 8.3)
* (6, 8.5)
* **lcb (Green Line):** The line starts at approximately 8.8 at x=0 and consistently increases to a peak of around 12.2 at x=5, then slightly decreases to approximately 11.9 at x=6. The trend is strongly upward.
* (0, 8.8)
* (1, 9.4)
* (2, 10.1)
* (3, 10.7)
* (4, 11.4)
* (5, 12.2)
* (6, 11.9)
* **mbpp (Red Line):** The line begins at approximately 8.8 at x=0, increases to around 9.3 at x=1, decreases to approximately 8.8 at x=2, and then sharply increases to approximately 11.2 at x=6. The trend is generally upward, with an initial fluctuation followed by a significant increase.
* (0, 8.8)
* (1, 9.3)
* (2, 8.8)
* (3, 9.1)
* (4, 9.5)
* (5, 10.3)
* (6, 11.2)
### Key Observations
* The 'lcb' benchmark consistently demonstrates the highest nesting depth across all values of failed LLMs.
* The 'humaneval' benchmark exhibits the most fluctuating nesting depth.
* The 'mbpp' benchmark shows a significant increase in nesting depth as the number of failed LLMs increases, particularly between x=4 and x=6.
* The 'bcb' benchmark remains relatively stable throughout the range of failed LLMs.
### Interpretation
The chart suggests that the number of failed LLMs can influence the nesting depth achieved on different benchmarks. The 'lcb' benchmark appears to be less sensitive to the number of failed LLMs, consistently achieving high nesting depths. Conversely, the 'mbpp' benchmark shows a strong positive correlation between the number of failed LLMs and nesting depth, indicating that more failures might lead to deeper nesting in this specific benchmark. The fluctuating behavior of 'humaneval' suggests that its nesting depth is more variable and potentially influenced by factors other than just the number of failed LLMs. The data implies that different benchmarks have varying levels of robustness to LLM failures, and the impact of failures on nesting depth is benchmark-specific. The increasing trend of 'mbpp' could indicate that the benchmark becomes more challenging or requires more complex reasoning as LLMs fail, leading to deeper nesting to resolve issues.