## Line Graph: Nesting Depth vs. Tasks Grouped by Number of Failed LLMs
### Overview
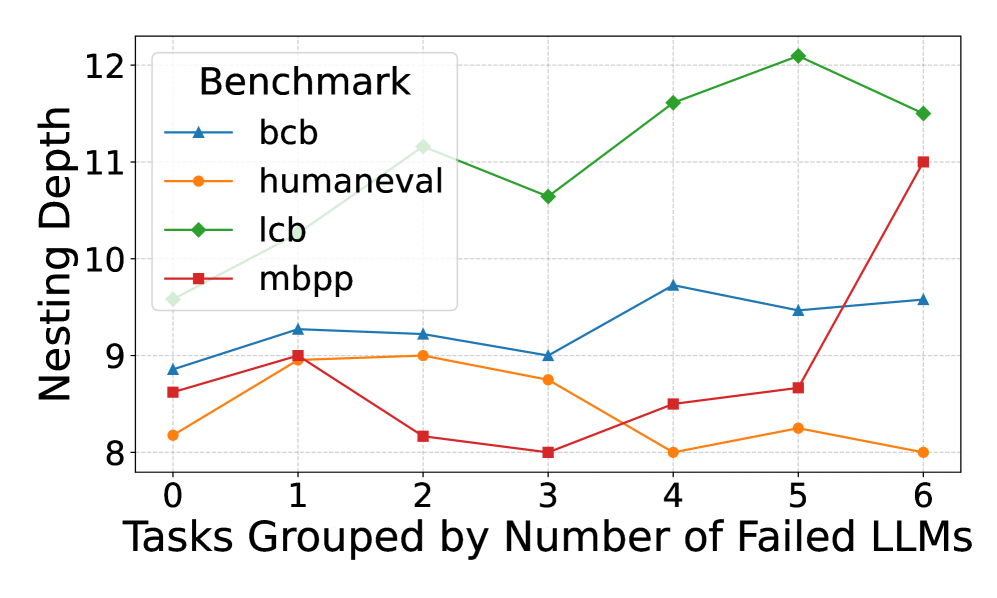
The image is a line graph comparing nesting depth across four benchmarks (bcb, humaneval, lcb, mbpp) as tasks are grouped by the number of failed LLMs (0–6). Nesting depth ranges from 8 to 12 on the y-axis, while the x-axis represents task groupings. The legend is positioned in the top-left corner, with distinct colors for each benchmark.
### Components/Axes
- **X-axis**: "Tasks Grouped by Number of Failed LLMs" (0–6, integer intervals).
- **Y-axis**: "Nesting Depth" (8–12, continuous scale).
- **Legend**:
- Blue triangle: bcb
- Orange circle: humaneval
- Green diamond: lcb
- Red square: mbpp
- **Lines**: Four distinct colored lines connecting data points for each benchmark.
### Detailed Analysis
#### bcb (Blue)
- Data points: (0, 9.0), (1, 9.2), (2, 9.1), (3, 9.0), (4, 9.7), (5, 9.5), (6, 9.6).
- Trend: Slight dip at task 3, followed by a rise and stabilization. Values remain relatively stable (9.0–9.7).
#### humaneval (Orange)
- Data points: (0, 8.2), (1, 8.9), (2, 9.0), (3, 8.8), (4, 8.0), (5, 8.2), (6, 8.0).
- Trend: Peaks at task 2 (9.0), then declines sharply to 8.0 by task 4, with minor fluctuations.
#### lcb (Green)
- Data points: (0, 9.5), (1, 11.0), (2, 10.5), (3, 10.7), (4, 11.5), (5, 12.0), (6, 11.3).
- Trend: Steady increase until task 5 (12.0), then a slight drop. Consistently the highest nesting depth.
#### mbpp (Red)
- Data points: (0, 8.6), (1, 9.0), (2, 8.1), (3, 8.0), (4, 8.5), (5, 8.7), (6, 11.0).
- Trend: Sharp rise at task 6 (11.0), with moderate fluctuations earlier. Outlier at task 6.
### Key Observations
1. **lcb** consistently exhibits the highest nesting depth, peaking at task 5 (12.0).
2. **mbpp** shows an anomalous spike at task 6 (11.0), far exceeding its earlier values.
3. **humaneval** declines after task 2, stabilizing at 8.0 for tasks 4–6.
4. **bcb** remains the most stable, with minor fluctuations (9.0–9.7).
### Interpretation
The data suggests that nesting depth correlates with task complexity or failure rates differently across benchmarks. **lcb**’s high and stable nesting depth implies it may involve inherently complex tasks or stricter failure thresholds. The **mbpp** outlier at task 6 could indicate a unique failure mode or edge case requiring deeper nesting. **humaneval**’s decline might reflect tasks becoming less nested as failures increase, possibly due to simplified error handling. **bcb**’s stability suggests robustness to failure rates. These trends highlight benchmark-specific behaviors in handling LLM failures, which could inform optimization strategies for task design or error mitigation.