TECHNICAL ASSET FINGERPRINT
570358fbe9de0ae2636ab1b3
Click to view fullscreen
Press ESC or click to close
FOUND IN PAPERS
EXPERT: gemini-2.0-flash VERSION 1
RUNTIME: nugit/gemini/gemini-2.0-flash
INTEL_VERIFIED
## Chart: Scaling Performance and Efficiency Analysis
### Overview
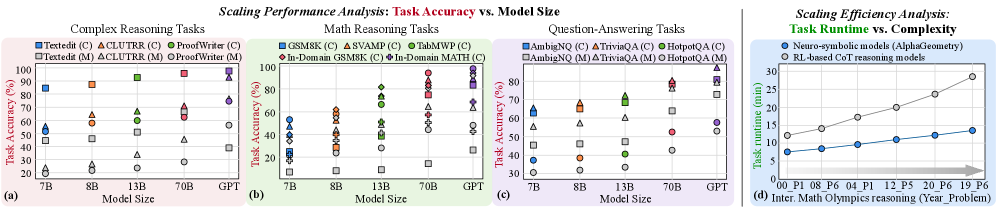
The image presents four scatter plots analyzing the scaling performance and efficiency of different models across various tasks. The first three plots (a, b, c) depict "Task Accuracy vs. Model Size" for Complex Reasoning, Math Reasoning, and Question-Answering tasks, respectively. The fourth plot (d) shows "Task Runtime vs. Complexity" for Neuro-symbolic and RL-based models.
### Components/Axes
**General:**
* **Title:** Scaling Performance Analysis: Task Accuracy vs. Model Size (for plots a, b, c) and Scaling Efficiency Analysis: Task Runtime vs. Complexity (for plot d)
* Each plot is labeled with a letter: (a), (b), (c), (d) in the bottom left corner.
**Plot (a): Complex Reasoning Tasks**
* **X-axis:** Model Size (7B, 8B, 13B, 70B, GPT)
* **Y-axis:** Task Accuracy (%) (Scale from 0 to 100, increments of 20)
* **Legend (top-left):**
* Blue Square: Textedit (C)
* Orange Triangle: ACLUTRR (C)
* Green Circle: ProofWriter (C)
* Gray Square: Textedit (M)
* Gray Triangle: ACLUTRR (M)
* Gray Circle: ProofWriter (M)
**Plot (b): Math Reasoning Tasks**
* **X-axis:** Model Size (7B, 8B, 13B, 70B, GPT)
* **Y-axis:** Task Accuracy (%) (Scale from 0 to 100, increments of 20)
* **Legend (top-left):**
* Blue Square: GSM8K (C)
* Orange Triangle: SVAMP (C)
* Green Circle: TabMWP (C)
* Red Diamond: In-Domain GSM8K (C)
* Purple Diamond: In-Domain MATH (C)
**Plot (c): Question-Answering Tasks**
* **X-axis:** Model Size (7B, 8B, 13B, 70B, GPT)
* **Y-axis:** Task Accuracy (%) (Scale from 30 to 80, increments of 10)
* **Legend (top-left):**
* Blue Square: AmbigNQ (C)
* Orange Triangle: TriviaQA (C)
* Green Circle: HotpotQA (C)
* Gray Square: AmbigNQ (M)
* Gray Triangle: TriviaQA (M)
* Gray Circle: HotpotQA (M)
**Plot (d): Task Runtime vs. Complexity**
* **X-axis:** Inter. Math Olympics reasoning (Year_Problem) (00_P1, 08_P6, 04_P1, 12_P5, 20_P6, 19_P6)
* **Y-axis:** Task runtime (min) (Scale from 5 to 30, increments of 5)
* **Legend (top-right):**
* Blue Circle: Neuro-symbolic models (AlphaGeometry)
* Gray Circle: RL-based CoT reasoning models
* There is a right-pointing arrow at the bottom of the chart, indicating increasing complexity.
### Detailed Analysis
**Plot (a): Complex Reasoning Tasks**
* **Textedit (C):** Accuracy increases from approximately 85% at 7B to 98% at 70B.
* **ACLUTRR (C):** Accuracy increases from approximately 58% at 7B to 70% at 70B.
* **ProofWriter (C):** Accuracy increases from approximately 20% at 7B to 65% at 13B, then to 70% at 70B.
* **Textedit (M):** Accuracy increases from approximately 45% at 7B to 48% at 8B, then to 55% at 13B, and then decreases to 45% at 70B.
* **ACLUTRR (M):** Accuracy increases from approximately 25% at 7B to 35% at 13B, then to 45% at 70B.
* **ProofWriter (M):** Accuracy increases from approximately 20% at 7B to 25% at 8B, then to 25% at 13B, and then to 30% at 70B.
**Plot (b): Math Reasoning Tasks**
* The data points are scattered, making it difficult to discern clear trends for each model.
* **GSM8K (C):** Accuracy ranges from approximately 20% to 55%.
* **SVAMP (C):** Accuracy ranges from approximately 25% to 75%.
* **TabMWP (C):** Accuracy ranges from approximately 30% to 95%.
* **In-Domain GSM8K (C):** Accuracy ranges from approximately 40% to 75%.
* **In-Domain MATH (C):** Accuracy ranges from approximately 10% to 35%.
**Plot (c): Question-Answering Tasks**
* **AmbigNQ (C):** Accuracy increases from approximately 65% at 7B to 70% at 8B, then to 75% at 13B, and then to 80% at 70B.
* **TriviaQA (C):** Accuracy increases from approximately 55% at 7B to 68% at 8B, then to 60% at 13B, and then to 80% at 70B.
* **HotpotQA (C):** Accuracy increases from approximately 38% at 7B to 40% at 8B, then to 65% at 13B, and then to 75% at 70B.
* **AmbigNQ (M):** Accuracy increases from approximately 45% at 7B to 55% at 8B, then to 58% at 13B, and then to 75% at 70B.
* **TriviaQA (M):** Accuracy increases from approximately 50% at 7B to 58% at 8B, then to 58% at 13B, and then to 75% at 70B.
* **HotpotQA (M):** Accuracy increases from approximately 30% at 7B to 30% at 8B, then to 40% at 13B, and then to 50% at 70B.
**Plot (d): Task Runtime vs. Complexity**
* **Neuro-symbolic models (AlphaGeometry):** Task runtime increases linearly from approximately 8 minutes to 15 minutes as complexity increases.
* **RL-based CoT reasoning models:** Task runtime increases linearly from approximately 12 minutes to 28 minutes as complexity increases.
### Key Observations
* For Complex Reasoning and Question-Answering tasks, the "C" versions of the models generally outperform the "M" versions.
* In Math Reasoning tasks, the performance varies significantly across different models and model sizes.
* In the Task Runtime vs. Complexity plot, RL-based CoT reasoning models consistently have higher task runtime compared to Neuro-symbolic models (AlphaGeometry).
* The GPT model size is only present in the Task Accuracy plots, and not in the Task Runtime plot.
### Interpretation
The data suggests that increasing model size generally improves task accuracy for Complex Reasoning and Question-Answering tasks, but the effect is less consistent for Math Reasoning tasks. The difference in performance between "C" and "M" versions of the models indicates that certain model architectures or training methods are more effective for specific tasks. The Task Runtime vs. Complexity plot highlights a trade-off between model type and computational cost, with Neuro-symbolic models demonstrating lower runtime compared to RL-based models for the same level of complexity. The arrow on the x-axis of plot (d) indicates that the problems are ordered by increasing difficulty.
DECODING INTELLIGENCE...
EXPERT: gemini-3.1-flash-lite-preview-free VERSION 1
RUNTIME: google-free/gemini-3.1-flash-lite-preview
INTEL_VERIFIED
This image contains four distinct charts, labeled (a) through (d), analyzing the performance and efficiency of various AI models across different tasks.
## Multi-Panel Chart: Scaling Performance and Efficiency Analysis
### Overview
The image is a composite of four sub-charts. Panels (a), (b), and (c) display "Task Accuracy vs. Model Size" for three different categories of reasoning tasks. Panel (d) displays "Task Runtime vs. Complexity" for International Math Olympiad problems. The charts compare different model sizes (7B, 8B, 13B, 70B, GPT) and different reasoning methodologies (denoted by (C) and (M) in the legends).
### Components/Axes
**Panels (a), (b), and (c):**
* **X-Axis:** Model Size, with categories: 7B, 8B, 13B, 70B, GPT.
* **Y-Axis:** Task Accuracy (%), ranging from 20% to 100% (or 30% to 90% in panel c).
* **Legends:**
* **(a) Complex Reasoning Tasks:**
* Textedit (C) [Blue Square], Textedit (M) [Grey Square]
* CLUTRR (C) [Orange Triangle], CLUTRR (M) [Grey Triangle]
* ProofWriter (C) [Green Circle], ProofWriter (M) [Grey Circle]
* **(b) Math Reasoning Tasks:**
* GSM8K (C) [Blue Square], GSM8K (M) [Grey Square]
* SVAMP (C) [Orange Triangle], SVAMP (M) [Grey Triangle]
* TabMWP (C) [Green Circle], TabMWP (M) [Grey Circle]
* In-Domain GSM8K (C) [Red Diamond]
* In-Domain MATH (C) [Purple Diamond]
* **(c) Question-Answering Tasks:**
* AmbigNQ (C) [Blue Square], AmbigNQ (M) [Grey Square]
* TriviaQA (C) [Orange Triangle], TriviaQA (M) [Grey Triangle]
* HotpotQA (C) [Green Circle], HotpotQA (M) [Grey Circle]
**Panel (d):**
* **X-Axis:** Inter. Math Olympics reasoning (Year_Problem), with categories: 00_P1, 08_P6, 04_P1, 12_P5, 20_P6, 19_P6.
* **Y-Axis:** Task runtime (min), ranging from 0 to 30.
* **Legend:**
* Neuro-symbolic models (AlphaGeometry) [Blue Circle]
* RL-based CoT reasoning models [Grey Circle]
---
### Detailed Analysis
#### Panel (a): Complex Reasoning Tasks
* **Trend:** All (C) series show a general upward trend as model size increases. The (M) series are consistently lower than their (C) counterparts and show flatter growth.
* **Data Points:**
* At 7B, accuracy ranges from ~20% (ProofWriter M) to ~85% (Textedit C).
* At GPT, accuracy ranges from ~40% (Textedit M) to ~95% (ProofWriter C).
#### Panel (b): Math Reasoning Tasks
* **Trend:** High variance in performance. (C) variants generally outperform (M) variants. The In-Domain (C) models (Red and Purple diamonds) show the highest performance at the 70B and GPT levels.
* **Data Points:**
* At 7B, accuracy is clustered between ~10% and ~55%.
* At GPT, accuracy is clustered between ~25% and ~95%.
#### Panel (c): Question-Answering Tasks
* **Trend:** All series show a clear, consistent upward slope from 7B to GPT.
* **Data Points:**
* At 7B, accuracy ranges from ~30% (HotpotQA M) to ~65% (AmbigNQ C).
* At GPT, accuracy ranges from ~55% (HotpotQA M) to ~90% (AmbigNQ C).
#### Panel (d): Scaling Efficiency Analysis
* **Trend:** Both model types show an upward slope, indicating that as problem complexity increases (left to right), runtime increases.
* **Data Points:**
* **Neuro-symbolic models (Blue):** Starts at ~7 minutes (00_P1) and rises steadily to ~13 minutes (19_P6).
* **RL-based CoT models (Grey):** Starts at ~12 minutes (00_P1) and rises more steeply to ~29 minutes (19_P6).
---
### Key Observations
1. **Methodology Gap:** In panels (a), (b), and (c), the (C) variants (likely Chain-of-Thought) consistently outperform the (M) variants across all model sizes.
2. **Scaling Returns:** Increasing model size generally correlates with higher task accuracy, though the rate of improvement varies by task type.
3. **Efficiency Divergence:** In panel (d), the gap between the Neuro-symbolic models and RL-based CoT models widens as the complexity of the math problems increases. The Neuro-symbolic approach is significantly more efficient (faster) than the RL-based CoT approach.
### Interpretation
The data demonstrates a clear hierarchy in performance based on methodology: the (C) variants are superior to (M) variants for reasoning tasks. Furthermore, the charts suggest that while scaling model size (up to GPT) improves accuracy, it does not eliminate the performance gap between different task types or methodologies.
Panel (d) provides a critical insight into the trade-offs of AI reasoning: while RL-based CoT models are a common approach, they are computationally more expensive (slower) than Neuro-symbolic models like AlphaGeometry. As problem complexity increases, the RL-based models' runtime grows significantly faster than the Neuro-symbolic models, suggesting that Neuro-symbolic architectures may be more scalable for high-complexity reasoning tasks where time efficiency is a constraint.
DECODING INTELLIGENCE...
EXPERT: nemotron-free VERSION 1
RUNTIME: free/nvidia/nemotron-nano-12b-v2-vl:free
INTEL_VERIFIED
## Chart/Diagram Type: Scaling Performance Analysis and Efficiency Analysis
### Overview
The image contains four graphs and a line chart analyzing the scaling performance of AI models across reasoning tasks and computational efficiency. The left three graphs (a, b, c) compare task accuracy vs. model size for complex reasoning, math reasoning, and question-answering tasks. The right graph (d) compares task runtime vs. complexity for neuro-symbolic and RL-based CoT models.
### Components/Axes
#### Graphs (a), (b), (c): Task Accuracy vs. Model Size
- **X-axis**: Model Size (7B, 8B, 13B, 70B, GPT)
- **Y-axis**: Task Accuracy (%)
- **Legends**:
- **Models**: Textedit, CLUTR, ProofWriter, GSM8K, SVAMP, TabMWP, In-Domain GSM8K, In-Domain MATH, AmbigNQ, TriviaQA, HotpotQA
- **Markers/Colors**:
- Squares (□): Textedit, GSM8K, AmbigNQ
- Triangles (△): CLUTR, SVAMP, TriviaQA
- Circles (●): ProofWriter, TabMWP, HotpotQA
- Colors: Blue, Orange, Green, Red, Purple, Gray
- **Subcategories**:
- (C): Chain-of-Thought (CoT) reasoning
- (M): MCT (Multi-step CoT) reasoning
#### Graph (d): Task Runtime vs. Complexity
- **X-axis**: Problem Complexity (P1, P8, P6, P4, P12, P5, P20, P6, P19, P6)
- **Y-axis**: Task Runtime (minutes)
- **Lines**:
- Blue: Neuro-symbolic models (AlphaGeometry)
- Gray: RL-based CoT reasoning models
### Detailed Analysis
#### Graphs (a), (b), (c): Task Accuracy vs. Model Size
- **Trends**:
- **Complex Reasoning (a)**:
- Textedit(C) (blue square): 50% (7B) → 90% (GPT)
- CLUTR(C) (orange triangle): 60% (7B) → 85% (GPT)
- ProofWriter(C) (green circle): 70% (7B) → 95% (GPT)
- **Math Reasoning (b)**:
- GSM8K(C) (blue square): 40% (7B) → 80% (GPT)
- In-Domain GSM8K(C) (red triangle): 50% (7B) → 85% (GPT)
- **Question-Answering (c)**:
- AmbigNQ(C) (blue square): 30% (7B) → 70% (GPT)
- TriviaQA(C) (orange triangle): 40% (7B) → 80% (GPT)
#### Graph (d): Task Runtime vs. Complexity
- **Trends**:
- Neuro-symbolic models (blue line): Runtime increases linearly from ~5 min (P1) to ~30 min (P19).
- RL-based CoT models (gray line): Runtime increases more steeply, from ~10 min (P1) to ~40 min (P19).
### Key Observations
1. **Model Size vs. Accuracy**:
- Larger models (e.g., GPT) consistently outperform smaller models (7B, 8B) across all tasks.
- CoT models (C) generally achieve higher accuracy than MCT models (M) for the same task.
2. **Runtime vs. Complexity**:
- RL-based CoT models require significantly more time than neuro-symbolic models for complex problems.
- Runtime scales non-linearly with problem complexity for RL-based models.
### Interpretation
- **Scaling Performance**:
- Increasing model size improves task accuracy, particularly for complex reasoning (e.g., GPT achieves 95% accuracy in ProofWriter(C) vs. 70% for 7B models).
- CoT approaches (C) are more effective than MCT (M) but may require larger models to reach peak performance.
- **Efficiency Trade-offs**:
- Neuro-symbolic models (AlphaGeometry) are computationally efficient but less accurate on highly complex tasks.
- RL-based CoT models achieve higher accuracy at the cost of increased runtime, suggesting a trade-off between precision and efficiency.
- **Outliers**:
- In graph (a), ProofWriter(C) (green circle) shows the steepest accuracy improvement with model size, suggesting it is optimized for scaling.
- In graph (d), the divergence between neuro-symbolic and RL-based models widens for problems P12 and P19, indicating RL models struggle more with extreme complexity.
This analysis highlights the importance of model architecture and scaling strategies in balancing accuracy and computational efficiency for AI reasoning systems.
DECODING INTELLIGENCE...